An Analysis of Profitability, Capital Structure, and Credit Risk in the Peruvian Microfinance Sector
Jordy Jhonathan Matos Bautista1*
Alexandra Betty Martinez Luna2
Gustavo Hugo Ninanya Cornejo3
Nivardo Alonzo Santillan Zapata4
Jimmy Alberth Deza Quispe5
1,2,3,4,5Faculty of Business Sciences, Continental University, Peru. |
AbstractThe Peruvian Cajas Municipales de Ahorro y Crédito (CMAC) have been integrating many people into the financial system since 1980. Their microfinance operations target both people and businesses. Hence, CMAC provides financial services to people and companies that many conventional banks might reject. Although CMAC firms have increased their operations, their profits and market share have fallen. Therefore, this study employed a PLS-SEM model to analyze the causes of this phenomenon. Following previous studies, the current analysis studied both internal and external factors. The latent variable capital structure was used to express the internal factors and indicators, while the latent variable credit risk represented the external factors. The dependent variable was profitability, and its indicators were ROA and ROE. The results of the analysis indicated that capital structure and credit risk were negatively related to profitability. Additional testing revealed that the principal causes might be attached to an increment of provisions. Moreover, CMAC managers do not accept private investors for fear of losing their power. Therefore, the recommendation is that CMAC managers improve their credit policies and share their power decisions to attract more investors. |
Licensed: |
|
Keywords: JEL Classification |
|
Received: 25 April 2022 |
Funding: This study received no specific financial support. |
Competing Interests: The authors declare that they have no competing interests. |
Acknowledgement:We are deeply grateful to the Cajas Municipales de Ahorro y Crédito firms that provided the necessary information to carry out this study. All of them were considered in this research. |
1. Introduction
The Peruvian financial system is supervised by the Superintendencia de Banco y Seguros and, to a lesser degree, by the Banco Central de Reserva (Agreed text of the General Law of the Financial System and the Insurance System and Organic Law of the Superintendence of Banking and Insurance, 2018). This system comprises 54 firms that hold assets of more than US$ 120 billion (Poggi, Romero, Luy, & Sotomayor, 2015). Firms that participate in the Peruvian market include banks, financial enterprises, Cajas Municipales de Ahorro y Crédito, Cajas Rurales de Ahorro y Crédito, and Entidades de Desarrollo de la Pequeña y Microempresa (Poggi et al., 2015). Obviously, the majority of assets are held by banks followed by financial enterprises and the Cajas Municipales de Ahorro y Crédito (CMAC; Mendiola et al., 2015).
The strengths of the Peruvian financial system are its high liquidity levels, low delinquency ratios, high provision ratios, and high profitability ratios (Central Reserve Bank of Peru, 2019). However, its principal weakness is its high degree of concentration and relatively low level of national coverage (Central Reserve Bank of Peru, 2020). Most banks are located in the largest cities and offer credit and services focused on businesses, consumption, mortgages, and revolving and non-revolving credit. The participation in these sectors is 75.4%, 12.7%, 6.8%, and 5.1%, respectively (Central Reserve Bank of Peru, 2020). However, many people cannot access these services due to their policies.
Microfinancing firms, therefore, attempt to close the gaps. In Peru, microfinancing is offered by supervised and non-supervised firms (Figueroa, San Martin, & Soto, 2018). The supervised firms are the CMAC, Cajas Rurales de Ahorro y Crédito (CRAC), Entidades de Desarrollo de la Pequeña y Mediana Empresa (EDPYMES), banks’ microfinancing branches, and the banks themselves (Leon, 2017). The non-supervised firms include Cooperativas de Ahorro y Crédito and non-governmental organizations. The object of the current analysis, CMAC, was created in the 1980s and has become the most crucial microfinancing institution that provides financial inclusion to people (Jaramillo, 2014). CMAC firms belong to the municipal governments. However, non-bureaucrats also participate in their management (Rona, 2011). CMAC firms have a high presence outside Lima and hold 40.6% of the microfinancing market share (Mendiola et al., 2015).
Originally, CMAC firms only operated in the cities. Since then, they have expanded into more than 500 offices across Peruvian territory, including Lima. Once, CMAC firms were only allowed to offer small loans and simple saving instruments to micro and small businesses (Garcia, Vega, & Velasquez, 2018). However, CMAC firms currently offer many regular bank services.
CMAC firms are unique to Peru since they were born out of a thesis proposal first implemented in Piura (Mendiola et al., 2015). The business model focused on providing loans to poor people. With the help of the Deutsche Gesellschaft für Internationale Zusammenarbeit, CMAC firms improved their internal management systems (Jaramillo, 2014). CMAC firms help increase financial inclusion and reduce Peru's economic and social inequality.
CMAC firms hold about half the total market in the microfinance sector collocations. They are the second most profitable financial institution based on their ROE of 13% (Mendiola et al., 2015). Their main strengths include their geographical spread and lower interest rates than traditional banks. However, in recent years, both the ROA and ROE of CMAC firms have started to decline (Mendiola et al., 2015). Hence, this analysis aims to discover the reasons for this decline. Moreover, the current study will be the first in the literature to analyze profitability behavior in the growing CMAC sector and will therefore inspire further investigations.
2. Theoretical Background
2.1. Profitability
The profitability of any firm is the result of both internal and external factors. Internal factors are mainly related to management issues, and external ones are the consequence of market conditions. Therefore, the latent variable capital structure will be used to represent the internal factors, while the credit risk will express the external characteristics (Lapo-Maza, Tello-Sánchez, & Mosquera-Camacás, 2021). The following sections will explain the described latent variables in more detail.
Profitability is the primary objective of businesses, and CMAC firms are no exception. Although CMAC firms began as public entrepreneurs, they depend on the market for their survival (Rona, 2011). Hence, they must profit from their operations. The CMAC firms' core business is the credit they give to entrepreneurs and small businesses. According to Mendiola et al. (2015), the principal cause of the profitability fall reported in recent years was the CMAC firms' expansion. In other words, the expenses associated with branches, employees, and administration had to be increased for CMAC firms to extend their presence to more places in Peru. At first glance, the expansion of CMAC firms seems to be a positive development. However, they have moved into saturated areas. Also, since CMAC firms are almost entirely state-owned companies, they are affected by political decisions about bureaucracy and management. Hence, some managers do not have the required skills but have gained their position and responsibilities through political connections (Mendiola et al., 2015). Also, the managerial positions are subject to a high turnover, which makes it difficult to plan, execute, and meet long-term objectives.
These practices thus affect CMAC firms' profitability. CMAC managers have forgotten that their business strengths rely on economies of scale, high productivity, asset quality, and funding cost. Additionally, CMAC firms’ low credit quality and lofty credit colocations goals have caused high levels of credit risk and delinquency (Gómez, Mena, & Beltrán, 2019).
In the current analysis, the profitability indicators will be ROA and ROE. ROA, or return on assets, is the relationship between net profit and total assets. It is employed to measure the assets' employment efficiency or the capability of the assets to generate earnings for the company. ROE, or return on equity, estimates the financial company's performance on its equity or own funds. Hence, ROE provides information about the capital gain of investors (Sherman, 2015). Usually, firms employ debt to acquire assets. Therefore, if the ROE ratio is larger than the ROA ratio, profits are more significant than debt costs.
2.1.1. Capital Structure and Profitability
The relationship between capital structure and business profitability has occasioned debates among academics. The capital structure refers to the proportion of assets financed with a company’s own resources and debt. Modigliani and Miller (1958) stated that capital structure did not relate to business profitability. However, years later, they modified that idea. Their new idea stated that there was a tax shield because of the taxation of debt interests. In the 1980s, Bradley, Jarrell, and Kim (1984) proposed the trade-off theory, which stated that each company has an ideal capital structure with the power to balance both debt advantages and capital costs.
In contrast, Myers and Majluf (1984) proposed the pecking order theory. They rejected the idea of a balance but endorsed the concept of information asymmetry. In that situation, firms have three financing sources available to them: retained profits, financial debt, and emission of bonds and shares (Mejia, 2013).
The pecking order theory claimed the existence of a static optimal debt level. However, Fischer, Heinkel, and Zechner (1989) explained that the optimum level of debt is dynamic and located on a spectrum. The position on this spectrum will depend on a firm’s risk, taxes, size, and other characteristics that predict the capital structure. Moreover, it will vary across time. Hence, Baker and Wurgler (2002) believed that firms with issued shares would be eager to buy stock when prices were low. Analogously, they would sell their stock when prices were high. That behavior is the difference between the shares book and market values and will hence impact capital structure. Byoun (2008) proposed a combination of the pecking order and trade-off theories. He found that when firms assumed debts above their optimum level, they used their surpluses to pay. Analogously, firms in debt below their optimum level try to recover their debts and capital through their excesses. Byoun (2008) and Ovtchinnikov (2010) both stated that the pecking order theory could not explain the capital structure decision. Moreover, Ovtchinnikov (2010) made the same claim for the trade-off theory. Here, the stakeholders' approach provides a possible explanation for capital structure decisions. This theory argues that the relationship between firms and stakeholders defines the company capital structure (Banerjee, Heshmati, & Wihlborg, 2000).
2.1.2. Bank Risk and Profitability
Risk is present in all firms. In finance, business risk mainly depends on credit risk. Indeed, many CMAC firms lost profits due to non-paid credit. Also, the other risk CMAC firms face is sustainability in every location. As stated before, CMAC expanded its branch offices into saturated locations, which exposed them to market risk (Lapo-Maza et al., 2021).
In addition, in the finance sector, there is liquidity risk. However, the SBS has regulated this risk by asking the CMAC to maintain a level of liquidity. The analysis of Lapo-Maza et al. (2021) divided the finance risk into two types: delinquency risk and provisions. Delinquency risk is linked directly to the quality of a CMAC's assets. Mendiola et al. (2015) stated that delinquency indicates institutional weakness. When the delinquency ratio is high, it affects the critical operations of CMAC firms. The SBS also demands that CMAC firms control both provisions and the delinquency ratio. However, the delinquency ratio has been increasingly affecting the profitability of many CMAC firms (Mendiola et al., 2015). They have made provisions to relieve the credit losses for non-payment. Hence, it is clear that delinquency ratios and provisions are highly related. Mendiola et al. (2015) found that bank delinquency and provisions correlated with ROE. They stated that the excessive amount of credit offered to clients increased the delinquency ratios and provisions.
2.2. Review of Empirical Literature
As stated in the previous part, it is theoretically possible that debt in the capital structure will increase firms' profitability due to tax shields. For instance, Chandra et al. (2019) found that capital structure increased firm profitability in Indonesian firms. Moreover, Toumi (2020) stated that capital structure positively influenced firms' profitability, especially for firms with good capital ratios. However, Dang and Garret (2015) and Paligorova and Xu (2012) found a negative relationship between highly indebted firms and profitability. Additionally, Mubyarto (2020) encountered an inverse relationship between capital structure and profitability for highly indebted firms. Also, Velnampy and Niresh (2012) stated that indebted firms are negatively associated with their gains. At the same time, debt had a positive relationship with debt-equity, which was expected. Nonetheless, Omoregie, Olofin, and Ikpesu (2019) concluded that capital structure was not relevant to profitability. Indeed, they argued that a firm's profitability was related to the market cycle rather than its capital structure.
Therefore, if debt can be harmless for business profitability, why do firms get indebted? Wardani and Subowo (2020) claimed that the main reason was business risk itself. Also, according to the theoretical review, high bank risks provide more profit. Indeed, Mongid and Muazaroh (2017) found that banks were eager to increase their profitability by assuming more risk through credit. Similarly, Owusu-boafo, Obeng, and Addo (2020) discovered that credit risk positively affected profitability. Also, Kutum (2017) found a positive relationship between credit risk and profitability, adding that bank size was a relevant factor. In other words, credit risk was desirable only if the firm had a solid financial background. However, Noman, Pervin, and Chowdhury (2015) found that credit risk harmed Bangladeshi banks' profitability. Also, Shair, Sun, Shaorong, Atta, and Hussain (2019) observed that credit, insolvency, and market competitors hurt profitability. Moreover, they stated that only liquidity risk was positively related to the profitability of Pakistanis banks.
For the variable and indicator selection, we also took into consideration previous studies such as those of Hu and Xie (2016); Mendoza and Rivera (2017); Siddik, Alam, Kabiraj, and Joghee (2017); Okumaga (2017), and Bucevska and Hadzi Misheva (2017). Nonetheless, we chose to follow the example set by Lapo-Maza et al. (2021) in their analysis of Ecuatorian banks analysis as the primary reference for the current study because of how they carried out their investigation. They combined capital structure, bank risk, and profitability and found that there was no relationship between capital structure and profitability; however, they discovered a negative relationship between credit risk and profitability. Therefore, this study will be based on the model proposed in that study. Consequently, this study will analyze the effects of credit risk and capital structure on delinquency ratios in CMAC firms from 2010 to 2021. Table 1 displays the latent variables and their indicators.
| Latent Variables | Indicators | Abbreviation |
| Credit risk | Delinquency index | MOR |
| Provision index | PRV | |
| Profitability | Return on assets ratio | ROA |
| Return on equity ratio | ROE | |
| Capital Structure | Debt over equity ratio | DOE |
| Capital adequacy ratio | CAD | |
| Indebtedness ratio | IND |
3. Methods
The study employed the monthly observations of nine CMAC firms from 2010 to 2021. The sample represented 96% of credit lent, 95% of total deposits, and 99% of the sector profits generated. Hence, the analyzed sample was highly significant. The research employed the PLS-SEM method, also known as Partial Least Squares. The reason was that this technique can be used to evaluate latent variables and the relationships among them (Hair, Hult, Ringle, & Sarstedt, 2013).
To understand PLS-SEM, is it necessary to first explain SEM. SEM, or Structural Equation Modeling, is a regression technique that analyzes the relationships between independent and dependent variables. However, unlike other techniques, SEM can explore multiple indicators of independent and dependent variables simultaneously. Its sub-model, PLS, consists of two parts: measurement and structural models (Venturini & Mehmetoglu, 2019). The measurement model provides the relationships between the constructs or latent variables and their indicators, while the structural model only portrays the relationships between the latent variables. Graphically, latent variables are displayed in ellipses and indicators in squares. The arrows from the boxes to the ellipses depict the reflectively measured constructs, while those from the ellipses to the boxes show the formative paths. Moreover, the arrows from the independent to the latent dependent variables represent the structural part of the model (Venturini & Mehmetoglu, 2019).
It is necessary to base the exact routes for the variables on an intensive literature review. The routes, called paths, have to explain the best possible relationships among the variables. Here, independent latent variables are called exogenous, while the dependent variable is known as endogenous. The researcher knows whether the chosen path is correct through the coefficients, which represent the relationships among the variables. Therefore, the structural part of the PLS-SEM model is highly similar to any regression model. In contrast, the measurement part is related to a principal component analysis (Venturini & Mehmetoglu, 2019). The PLS-SEM model can be characterized as an advanced multivariate technique.
The PLS-SEM model is estimated in three parts. First, the scores of the latent variables are calculated individually. With those scores, the measurement model parameters are estimated. Finally, the structural model parameters or path coefficients are obtained. Only the first step is unique to the PLS-SEM model because the other steps are similar to any regression analysis (Venturini & Mehmetoglu, 2019). However, it is impossible to get p values and confidence intervals for estimations because PLS-SEM was conceived as a distribution-free method. Therefore, PLS-SEM employs the bootstrap technique to estimate standard errors and parameters. It has been suggested that bootstrap should be used along with bias correction and accelerated confidence intervals to adjust biases and skewness in the distributions (Henseler, Hubona, & Ray, 2016).
The goodness indicators of a PLS-SEM model are a controversial issue since there are no defined criteria. Both R2 values and goodness of fit (GOF) indices have been proposed. GOF is employed to avoid redundancy in the proposed model because it considers the model measurement and structural performance (Venturini & Mehmetoglu, 2019). GOF estimates each latent variable or communality to obtain its geometrical mean and R2 value. Although R2 might sound like a validation indicator, it is not since the PLS-SEM lacks an optimization criterion. To overcome this disadvantage, Cronbach alpha and the Dillon-Goldstein coefficient are possible solutions for validating the model (Venturini & Mehmetoglu, 2019). Also, the average variance extracted (AVE) is used to measure convergent validity at the construct level. Finally, because Cronbach alpha tends to underestimate the internal consistency reliability, the Dillon-Goldstein index is preferred (Venturini & Mehmetoglu, 2019). The Cronbach alpha should be more than 0.7 and the AVE more than 0.5 for the model to be considered correct (Hair et al., 2013).
Additionally, Lapo-Maza et al. (2021) stated that cross-loadings could be employed to assess the discriminant validity. In other words, an indicator loading must be more extensive than any other to be considered the most relevant. Although Lapo-Maza et al. (2021) recommended employing the Vector Inflation Factor to check collinearity, it was not possible in this study due to the employment of bootstrap in the model. Figure 1 portrays the graphic construction of the model.
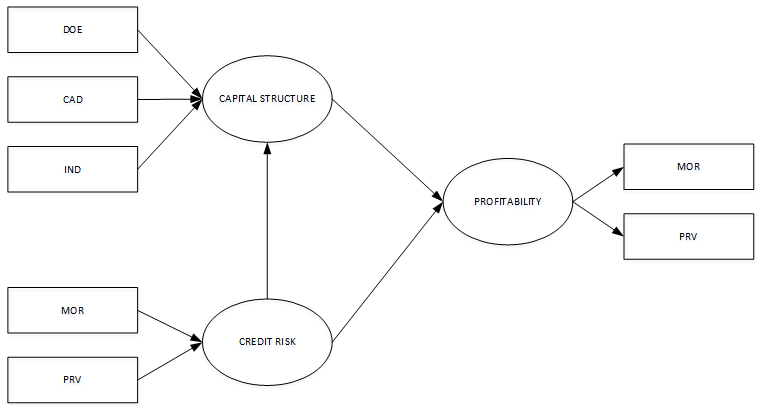
Figure 1. Structural model.
4. Results
Table 2 shows the descriptive statistics for the analyzed sample. There were missing data in the MOR, PRV, ROE, and CAD indicators. Moreover, the ROE indicator showed that there was always one CMAC firm with losses. Table 3 depicts the means of the descriptive statistics for each CMAC. That table shows that Tacna had the highest MOR, and Huancayo the lowest. In terms of the PRV, Tacna also had the highest average, and Sullana had the lowest standard. For the ROA indicator, Trujillo had the highest average.
Huancayo obtained the most significant ROE score. In both ROA and ROE, Maynas had the lowest average. Trujillo had the highest average gain in DOE, and Arequipa the lowest. In the CAD and IND indicators, Sullana had the highest standard, while Trujillo had the lowest. TACNA was shown to have issues managing its credit since it had the most extended MOR ratio and a high PRV. Huancayo had the lowest MOR on average, which showed a sound credit policy reflected in its ROE. In the case of Trujillo, it had the lowest CAD and IND indicators but the highest DOE. This combination affected its high ROA. Maynas had the lowest ROA and ROE. When the other components were analyzed, it became clear that they had a high PRV, which might have affected those ratios.
| Indicators | Mean |
Std. Dev |
Median |
Min. |
Max. |
N |
| MOR | 6.13 |
2.003 |
6.035 |
1.93 |
20.41 |
1108 |
| PRV | 64.247 |
62.699 |
25.06 |
1.44 |
183.46 |
1233 |
| ROA | 2.527 |
3.925 |
2.16 |
-25.51 |
19.72 |
1233 |
| ROE | 14.532 |
5.727 |
14.83 |
0.61 |
27.88 |
1002 |
| DOE | 7.801 |
2.556 |
7.23 |
4.02 |
16.96 |
1233 |
| CAD | 16.17 |
2.004 |
15.62 |
13.12 |
23.38 |
1108 |
| IND | 0.859 |
0.027 |
0.86 |
0.79 |
0.93 |
1233 |
| Names | MOR |
PRV |
ROA |
ROE |
DOE |
CAD |
IND |
| Ica | 6.93 |
61.83 |
1.86 |
12.92 |
15.91 |
7.73 |
0.86 |
| Maynas | 6.45 |
66.89 |
1.33 |
8.96 |
16.37 |
6.17 |
0.85 |
| Piura | 7.02 |
70.77 |
1.41 |
12.25 |
14.88 |
9.04 |
0.89 |
| Arequipa | 5.16 |
73.80 |
2.38 |
18.88 |
14.84 |
8.66 |
0.88 |
| Cusco | 4.50 |
65.46 |
2.72 |
16.11 |
16.46 |
6.32 |
0.84 |
| Huancayo | 3.79 |
73.13 |
2.90 |
19.38 |
16.23 |
6.95 |
0.86 |
| Sullana | 6.31 |
19.40 |
2.91 |
16.39 |
15.99 |
13.37 |
0.89 |
| Tacna | 8.04 |
75.27 |
2.26 |
11.97 |
15.78 |
6.76 |
0.86 |
| Trujillo | 7.13 |
71.66 |
4.97 |
12.27 |
18.93 |
5.22 |
0.82 |
| Indicators | Risk |
Profitability |
Structure |
| MOR | 0.81 |
||
| PRV | -0.582 |
||
| ROA | 0.987 |
||
| ROE | 0.976 |
||
| DOE | 0.848 |
||
| CAD | -0.858 |
||
| IND | 0.947 |
The standardized loadings are shown in Table 4; a positive charge from MOR to credit risk can be seen in the formative model. However, PRV also has a negative sign on its latent variable. DOE and IND had positive charges in the capital structure, while CAD had a negative effect. In the model, both ROA and ROE had positive charges. The Cronbach alpha showed values between 0.8 and 0.9, which met the requirements of Hair et al. (2013). Moreover, although the Dillon-Goldstein test resulted in slightly lower scores than the Cronbach alpha, they remained in the suggested range. Table 5 shows that the results of the AVE analysis ranged from .498 to .983, as Hair et al. (2013) indicated.
| Variables | Risk |
Profitability |
Structure |
| Risk | 1.000 |
0.285 |
0.037 |
| Profitability | 0.287 |
1.000 |
0.070 |
| Structure | 0.037 |
0.070 |
1.000 |
| AVE | 0.498 |
0.963 |
0.783 |
The standardized path coefficients in Table 6 show that both risk and capital structure negatively affected profitability. Both effects were statistically significant at 1%. However, the capital structure had a positive relationship with credit risk, which was also significant at 1%. The R2 showed that the GOF was moderate for the profitability relationships; however, for the capital structure relationship, it was weak. Also, Table 7 shows the correlation among the latent variables. Here, it is demonstrated that profitability was negatively correlated with risk and capital structure, but risk and capital structure were positively correlated. Finally, Table 8 shows the cross-loadings among the indicators and latent variables, which serve to analyze the discriminant validity of the model. That analysis ensures that hands did not have higher charges than their latent variable. Table 8 shows that the study met all the assumptions.
| Variables | Profitability |
Structure |
| Risk | -0.501 (0.000) *** |
0.193 (0.000) *** |
| Structure | -0.168 (0.000) *** |
|
| R2 | 0.311 |
0.036 |
Note: *** significant at 1%. |
| Variables | Risk |
Profitability |
Structure |
| Risk | 1 |
||
| Profitability | -0.5336 |
1 |
|
| Structure | 0.1935 |
-0.2651 |
1 |
| Indicators | Risk |
Profitability |
Structure |
| MOR | 0.8102 |
-0.455 |
0.0927 |
| PROV | -0.582 |
0.2791 |
-0.2015 |
| ROA | -0.5526 |
0.9869 |
-0.399 |
| ROE | -0.4859 |
0.9762 |
-0.0741 |
| DOE | 0.0978 |
-0.1109 |
0.8476 |
| CA | -0.2276 |
0.2155 |
-0.8578 |
| IND | 0.1561 |
-0.3105 |
0.9466 |
5. Discussion
This study analyzed nine firms over the 2010–2021 period. The analysis employed the PLS-SEM technique to investigate the relationships between the latent variables of the CMAC firms. The results showed that credit risk and capital structure negatively affected profitability. Regarding the capital structure analysis, these results do not align with the findings of Chandra et al. (2019) and Toumi (2020). Nonetheless, they agree with the results of Dang and Garret (2015); Paligorova and Xu (2012); Velnampy and Niresh (2012), and Mubyarto (2020). When analyzing the relationship between credit risk and capital structure, the results conform with the findings of Wardani and Subowo (2020), who also found an association between credit risk and capital structure. Therefore, as previously noted, the controversy about the relationship between capital structure and profitability continues.
Only for the credit risk analysis did the study find a negative relationship with profitability. This result aligns with those of Mongid and Muazaroh (2017) and Noman et al. (2015). On the other hand, it contradicts the findings of Kutum (2017) and Owusu-boafo et al. (2020). It was impossible to compare these results with Shair et al. (2019) because of the absence of a risk liquidity analysis in the current study. Hence, clarifying the correspondence between this study and Shair et al. (2019) was not feasible.
The mixed effect analyzed by Lapo-Maza et al. (2021) found a negative correlation between credit risk and profitability. However, no meaningful relationship between capital structure and profitability was found. In addition, Lapo-Maza et al. (2021) observed a positive effect between credit risk and capital structure, as was found in this study. Remarkably, the negative relationship between credit risk and profitability contradicts the claims of Mongid and Muazaroh (2017). They stated that finance firms improve their profitability by providing riskier credit. Both our descriptive statistics and Mendiola et al. (2015) showed that CMAC firms are making a mistake by lowering credit standards. This practice increases the delinquency rate and decreases profitability.
Moreover, the results showed that PRV had a negative charge on its latent variable. It is expected that when MOR increases, the PRV will also increase since it is employed to cover the losses of debtors. Then, poorly evaluated credit will only create losses for the CMAC in general. However, as the descriptive statistics showed, CMAC firms with indebted capital structures displayed better profitability performances. Furthermore, CAD had a negative charge on its latent variable. Therefore, the claim that debt improves profitability might be accurate for many CMAC firms. Due to credit risks, more CMAC firms may start working with debt to enhance their poor results; however, this can result in even greater risks for CMAC firms if no other management measures are taken. Additionally, due to the CMAC firms’ source of funds, the negative relationship between capital structure and profitability can be linked to the massive use of state funds rather than that of investors or financial creditors.
Although it was weak, there was a meaningful relationship between credit risk and capital structure. An explanation might be the CMAC firms’ need to cover losses associated with their poor credit management. Hence, CMAC managers get indebted to manage losses caused by clients' delinquency.
6. Conclusions
The current analysis evaluated the effects of internal and external factors on the profitability of CMAC firms for the period 2010–2021. As stated in the introduction, CMAC firms have long had success in providing financing products to people outside the banking system. However, they have recently been dealing with decreases in profits, as noted by Mendiola et al. (2015). A possible reason for this phenomenon is the poor credit management and conflict administration of CMAC firms. Hence, it is unsurprising that the results show a negative relationship between credit risk and profitability.
Since CMAC firms are financed with public resources, bureaucrats can retain management decision-making power. However, this often precludes the entrance and participation of investors and qualified people. It can cause a negative relationship between their capital structure and profitability. This scenario is not in either the public or the private interest since CMAC firms then ask for external funding to cover their losses or even use public funds to cover them. Also, the lack of qualified people in critical sectors, like credit offices, can contribute to poor credit management.
Consequently, CMAC firms must improve their credit and management policies to preserve their market share. According to Mendiola et al. (2015), bank branches are becoming more prominent in the microfinance market, which is a trend that could continue if action is not taken. A possible measure to manage that situation could be to run CMAC firms as private companies, which could help attract both investors and qualified people. Moreover, CMAC firms should adapt their strategies to protect their valuable market share in the competitive Peruvian microfinance market. One way to protect them might be to offer practical business consultancies or introductory financial literacy sessions.
Furthermore, it is necessary to keep in mind that CMAC firms cater to a sector largely considered too risky for traditional banks. Therefore, measures must be taken to balance risk and profitability. For instance, they might categorize their clients to evaluate what credit cost would be most profitable to their business. In other words, they could provide each group with a set type and amount of credit that takes each minor sector's risk into account. For example, CMAC firms could provide certain credit conditions for small factories, others for farmers, yet others for mini markets, etc.
The CMAC firms could also provide a joint debit and credit card for their users to increase their national reach. For CMAC users, it is problematic to have a separate card for each CMAC, and the CMAC firms also have a limited territory scope compared to traditional banks. Hence, a union for the emission of cards could expand CMAC firms’ horizons and allow them to increase their market share in the national territory. Finally, CMAC firms could expand into rural territories that are poorly attended by small rural banks. They could provide a service that suits farmers' particular needs by offering branch offices closer to them.
For future research, based on the theoretical background, more ratios can be employed to explain the factors that contribute to the profitability of other firms in the finance sector. For instance, Cajas Rurales de Ahorro y Crédito or Entidades de Desarrollo de la Pequeña y Microempresa could be studied to gain a better understanding of the probable causes of their profitability.
References
Agreed text of the General Law of the Financial System and the Insurance System and Organic Law of the Superintendence of Banking and Insurance. (2018). Testimony of the Congress of the Republic of Peru.
Baker, M., & Wurgler, J. (2002). Market timing and capital structure. The Journal of Finance, 57(1), 1-32.Available at: http://www.jstor.org/stable/2697832.
Banerjee, S., Heshmati, A., & Wihlborg, C. (2000). The dynamics of capital structure. SSE/EFI Working Paper Series in Economics and Finance, No. 333, Stockholm School of Economics.
Bradley, M., Jarrell, G. A., & Kim, E. H. (1984). On the existence of an optimal capital structure: Theory and evidence. The Journal of Finance, 39(3), 857–878.Available at: https://doi.org/10.2307/2327950 .
Bucevska, V., & Hadzi Misheva, B. (2017). The determinants of profitability in the banking industry: Empirical research on selected Balkan countries. Eastern European Economics, 55(2), 146-167.Available at: https://doi.org/10.1080/00128775.2016.1260473 .
Byoun, S. (2008). How and when do firms adjust their capital structures toward targets? The Journal of Finance, 63(6), 3069-3096.Available at: https://doi.org/10.1111/j.1540-6261.2008.01421.x .
Central Reserve Bank of Peru. (2019). Entidades financieras. Retrieved from: https://www.bcrp.gob.pe/sitios-de-interes/entidades-financieras.html.
Central Reserve Bank of Peru. (2020). November 2020 Financial Stability Report (Issue November).
Chandra, T., Junaedi, A. T., Wijaya, E., Suharti, S., Mimelientesa, I., & Ng, M. (2019). The effect of capital structure on profitability and stock returns. Journal of Chinese Economic and Foreign Trade Studies, 12(2), 74–89.Available at: https://doi.org/10.1108/JCEFTS-11-2018-0042 .
Dang, V., & Garret, I. (2015). On corporate capital structure adjustment. Finance Research Letters, 14, 56–63.Available at: https://doi.org/https://doi.org/10.1016/j.frl.2015.05.016 .
Figueroa, M., San Martin, A., & Soto, J. (2018). Good financial practices in credit risk management of companies in the banking sector. [Posgradute Dissetation, Pontifical Catholic University of Peru]. Repository of the Pontifical Catholic University of Peru.
Fischer, E., Heinkel, R., & Zechner, J. (1989). Dynamic capital structure choice: Theory and tests. Journal of Finance, 44(1), 19-40.Available at: https://doi.org/10.1111/j.1540-6261.1989.tb02402.x .
Garcia, J., Vega, C., & Velasquez, J. (2018). Participation of the municipal savings and credit banks in the strategic formulation of concerted development plans. [Postgraduate Dissertation, University of the Pacific]. Institutional Repository of the Pacific University.
Gómez, G., Mena, A., & Beltrán, L. R. (2019). Study of the determinant factors of the growth of municipal savings and credit cooperatives in Peru. Accounting and Administration, 64(3), 1–18.Available at: https://doi.org/10.22201/FCA.24488410E.2018.1596 .
Hair, J., Hult, T., Ringle, C., & Sarstedt, M. (2013). A primer on partial least squares structural equation modeling. In Long Range Planning, 46(1–2), 184-185.Available at: https://doi.org/10.1016/j.lrp.2013.01.002 .
Henseler, J., Hubona, G., & Ray, P. A. (2016). Using PLS path modeling in new technology research: Updated guidelines. Industrial Management and Data Systems, 116(1), 2–20.Available at: https://doi.org/10.1108/IMDS-09-2015-0382 .
Hu, T., & Xie, C. (2016). Competition, innovation, risk-taking, and profitability in the Chinese Banking Sector: An empirical analysis based on structural equation modeling. Discrete Dynamics in Nature and Society, 1-11.Available at: https://doi.org/10.1155/2016/3695379 .
Jaramillo, M. (2014). The model of the municipal fund in Peru. Retrieved from: http://www.grade.org.pe/wp-content/uploads/130412_ECO_Mic_BRIEF4_Esp.pdf.
Kutum, I. (2017). The impact of credit risk on the profitability of banks listed on the Palestine exchange. Research Journal of Finance and Accounting, 8(8), 136-141.
Lapo-Maza, M. D. C., Tello-Sánchez, M. G., & Mosquera-Camacás, S. C. (2021). Profitability, capital and credit risk in ecuadorians banks. Administrative Investigation, 50(127), 1–23.Available at: https://doi.org/10.35426/iav50n127.02.
Leon, J. (2017). Financial inclusion of micro, small and medium enterprises in Peru (First). Economic Commission for Latin America and the Caribbean-United Nations. Retrieved from: https://www.cepal.org/es/.../43220-la-igualdad-legal-la-discriminacion-hech.
Mejia, A. (2013). The capital structure in the company: Its contemporary study. Finance and Economic Policy Review, 5(2), 141–160.Available at: https://doi.org/10.14718/revfinanzpolitecon.v5.n2.2013.446 .
Mendiola, A., Aguirre, C., Aguilar, J., Chauca, P., Dávila, M., & Palhua, M. (2015). Sustainability and profitability of municipal savings and credit banks (CMAC) in Peru. ESAN University. Retrieved from: https://repositorio.esan.edu.pe/handle/20.500.12640/113 .
Mendoza, R., & Rivera, J. P. R. (2017). The effect of credit risk and capital adequacy on the profitability of rural banks in the Philippines. Scientific Annals of Economics and Business, 64(11), 83–96.Available at: https://doi.org/10.1515/saeb-2017-0006 .
Modigliani, F., & Miller, M. H. (1958). The cost of capital, corporation finance and the theory of investment. The American Economic Review, 48(3), 261-297.
Mongid, A., & Muazaroh, M. (2017). On the nexus between risk taking and profitability: Evidences from Indonesia. International Journal of Business and Society, 18(2), 271-284.Available at: https://doi.org/10.33736/ijbs.483.2017 .
Mubyarto, N. (2020). The influence of profitability on firm value with capital structure as the mediator. Jurnal Ekonomia, 16(2), 184–199.Available at: https://doi.org/10.21831/economia.v16i2.30405 .
Myers, S. C., & Majluf, N. S. (1984). Corporate financing and investment decisions when firms have information that investors do not have. Journal of Financial Economics, 13(2), 187-221.Available at: https://doi.org/https://doi.org/10.1016/0304-405X(84)90023-0 .
Noman, A., Pervin, S., & Chowdhury, M. M. (2015). The effect of credit risk on the banking profitability: A case on Bangladesh. Global Journal of Management and Business Research: C Finance, 15(3), 41–48.
Okumaga, K. (2017). Effect of capital structure on financial performance of firms in the commercial and service sector in the Nairobi securities exchange for the period 2012-2016. Doctoral Dissertation, United States International University-Africa.
Omoregie, O. K., Olofin, S. A., & Ikpesu, F. (2019). Capital structure and the profitability-liquidity trade-off. International Journal of Economics and Financial Issues, 9(3), 105-115.Available at: https://doi.org/10.32479/ijefi.7758 .
Ovtchinnikov, A. V. (2010). Capital structure decisions: Evidence from deregulated industries. Journal of Financial Economics, 95(2), 249-274.Available at: https://doi.org/10.1016/j.jfineco.2009.10.003 .
Owusu-boafo, R., Obeng, E., & Addo, J. Y. (2020). The relationship between credit risk management and the profibtality of banks in Ghana. ACTA VSFS, 14(2), 92–114.
Paligorova, T., & Xu, Z. (2012). Complex ownership and capital structure. Journal of Corporate Finance, 18(4), 701-716.
Poggi, J., Romero, L., Luy, M., & Sotomayor, N. (2015). Peruvian financial system 1990-2014: Maintaining the balance between development and financial stability. Financial Issues Magazine, 11(1), 1-22.
Rona, J. (2011). Reflections on the Chilean financial system. Reflections on the Chilean Financial System, 5(15), 167–174.Available at: https://doi.org/10.2307/j.ctv1kr4mqg .
Shair, F., Sun, N., Shaorong, S., Atta, F., & Hussain, M. (2019). Impacts of risk and competition on the profitability of banks: Empirical evidence from Pakistan. PloS One, 14(11), e0224378.Available at: https://doi.org/10.1371/journal.pone.0224378 .
Sherman, E. (2015). A manager's guide to financial analysis (6th ed.): American Management Association.
Siddik, M., Alam, N., Kabiraj, S., & Joghee, S. (2017). Impacts of capital structure on performance of banks in a developing economy: Evidence from Bangladesh. International Journal of Financial Studies, 5(2), 1-18.Available at: https://doi.org/10.3390/ijfs5020013 .
Toumi, K. (2020). Islamic ethics, capital structure and profitability of banks; What makes Islamic banks different? International Journal of Islamic and Middle Eastern Finance and Management, 13(1), 116–134.Available at: https://doi.org/10.1108/IMEFM-05-2016-0061.
Velnampy, T., & Niresh, J. (2012). The relationship between capital structure and profitability. International Journal of Business and Social Science, 3(16), 104–112.
Venturini, S., & Mehmetoglu, M. (2019). Plssem: A stata package for structural equation modeling with partial least squares. Journal of Statistical Software, 88(1), 1–35.Available at: https://doi.org/10.18637/jss.v088.i08 .
Wardani, O. M., & Subowo, S. (2020). Factors that influence capital structure with profitability as a moderating variable. Accounting Analysis Journal, 9(2), 103-109.Available at: https://doi.org/10.15294/aaj.v9i2.30541.