Online Versus Traditional Shopping in Developing Countries Study Case - Kosovo
Shaip Bytyçi
Faculty Dean, AAB College, Faculty of Economics, Kosovo. |
AbstractThe aim of this study is to analyse the behaviour of consumers in developing countries with a particular emphasis on traditional shopping versus online shopping in Kosovo. Specifically it is recognized that online shopping replaces traditional shopping in all developed countries but it is worth noting that countries with emerging economies cannot yet claim to replace traditional shopping as a cause of civil awareness, technology awareness, online payments, etc. In this study we used the primary data to achieve the main purpose. The primary data were provided through the online questionnaire in a random sample of 300 respondents. The data were calculated using IBM SPSS concluding in the analyses such as descriptive statistics, frequencies, linear regression, Pearson Chi - Square Test and Pearson correlation. The paper comes with some key conclusions that online shopping in Kosovo is affected by the employment status and education and is not influenced by age and gender. Also we came in conclusion that the respondents prefer online shopping for one main reason – time loss reduction. |
Licensed: |
|
Keywords: JEL Classification |
|
|
|
Funding: This study received no specific financial support. |
Competing Interests:The author declares that there are no conflicts of interests regarding the publication of this paper. |
1. Introduction
The rapid development of science and information technology including the Internet has made a big contribution to digital marketing as well. The presence of the internet nowadays in every field and especially in marketing has made the number of online shopping transactions increasing. However, regarding the development of online shopping in developing countries we still do not have any concrete research to highlight the potential of online shopping in these countries.
Traditional shopping refers to regular shopping whereby people meet their needs. In most cases consumers feel pressured during traditional shopping by the fact that they claim to visit all the shops and make the selection of some single products. The development of the banking sector, namely e-banking and online payments, is always evidenced by online shopping which also change the marketing strategies for businesses in terms of responsiveness. Globalization makes the world smaller, and not by accident the fast and dynamic development of the business is that also changes the consumer culture of shopping and every day more traditional shopping is being replaced by online shopping because of the dynamic of social life. In addition, prolonged work schedules, the reason that online shopping reduces lost time, have services at all times; the payroll procedure is simple and more. Advancement in Internet technology has facilitated the growth of home shopping.
Nowadays when consumers make online shopping we referred only to the internet shopping using different channels such as social networks, different web pages. The ever-evolving development of communication technology is replacing traditional shopping with online shopping and this as a result that consumer reduce time loss when shopping online and their dynamic life.
2. Literature Review
Modern consumers are becoming faster; they want to be able to shop anywhere, anytime and from the location of their choice. They require customized shopping trips to fit their needs as they navigate through and across multiple channels on online and offline paths (Deloitte, 2015).
Consumers today expect efficiencies and reliability as part of their purchase package, whether online or offline. In the online environment, they expect the websites to load and function effortlessly. The entire process from searching and comparing, to purchase and payment needs to be simple and risk-free (Mathewson & Moran, 2016). The business-to-consumer interaction has clearly increased with the development of the Internet where online consumers are in many cases not only consumers but also creators of information. This is the reason why companies regard “word-of-mouth” of high importance. Online consumers’ “creativity and information-sensitivity has brought up the use of ‘word-of-web’ or ‘word-of-mouse’”. As the creativity rises among consumers, so should the approaches used by marketers and companies in order to fully exploit the Internet as a marketplace (Kotler, Wong, Saunders, & Armstrong, 2005).
Information and communication technologies (ICTs) have experienced a persistent increase in usage over the last 25 years, which, in the context of e-commerce, allow for a more flexible spatial and temporal accomplishment of shopping According to Huseynov and Yıldırım (2014) the lack of physical interaction tends to be the critical barrier to online retailing, followed by the privacy of individual information and the security of financial transactions over the Internet. The intention to shop online is much higher for search (e.g. electronic appliances, books or other media products) than experience goods (e.g. fresh food, perfume or cars), as online shopping reduces search costs substantially while the dominant product attributes of experience goods cannot be obtained online (Chocarro, Cortiñas, & Villanueva, 2013). In the recent years, the United Nations Centre for Trade and Development has emphasizing the importance of e-commerce, especially online shopping for developing countries (UNCTAD, 2017) However, brand image and quality of products, goodwill of country of origin also influence significantly on purchase intention of online products (Hoque, Ali, & Mahfuz, 2015). According to Lee and Lin (2005) the online shopping satisfaction can increase the intention of new customers but does not affect customers to return. In fact, online stores that use value-added mechanisms in the search engine and providing customers with a challenging experience can increase customer shopping satisfaction. Davis (2012) the editor of Internet Retailer magazine, estimated that 25 million online retailers sell products over the Interne. Online shopping provides consumers with more information and opportunities to compare products and prices, with greater product selection, with convenience and ease of finding desired products online (Butler & Peppard, 1998). A definition of online trust was formed as “an attitude of safe expectation in an online situation of risk that one's weaknesses will not be exploited” (Beldad, De Jong, & Steehouder, 2010).
3. Research Methodology
This research is based on international academic and scientific literature on the importance of online shopping over traditional one. Based on the scientific findings and references of the above authors we have included the method of data collection in order to accomplish the purpose of this research. The analysis in this study is mainly based on primary data which means first-hand data collected by the researcher himself. In this study, primary data were obtained through online questionnaire. During the preparation of the questionnaire, we paid special attention to the design of the questions both in the presentation and in the structure for the sake of being able to collect sufficient data necessary to achieve the main aim of this paper.
The questionnaire was designed with structured questions (with options such yes or no, with categorization using the Likert scale, and an open-ended question with the purpose of obtaining respondents' opinions on the importance of online shopping vs traditional shopping in developing countries with special emphasis in Kosovo). The total number of questions asked in the questionnaire is 19, divided into two sections: introductory section which included demographic questions; and the second section including questions related to the scope of the study. The number of respondents is 300 and were randomly selected with voluntary participation in the study. Descriptive statistics analysis, frequencies, Pearson correlation analysis, regression analysis, and crosstabulations Pearson Chi Square – Test were employed in the study. The data collected from this research were analyzed with IBM SPSS software.
4.Resultsand Discussion
In this section we will present the findings from the research and the results obtained. We interpret the Cross Tabulations tables and Pearson Chi Square – Test, Linear Regression and Pearson Correlation for ordinal variables that we have in the analysis.
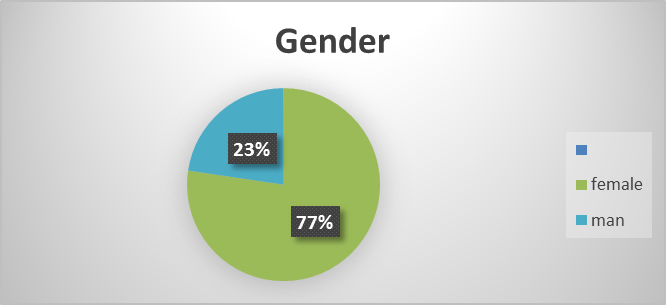
Figure-1. Respondents by gender.
Figure 1 shows the percentage of respondents by gender, with females participating in the survey with 77% and males with 23%.
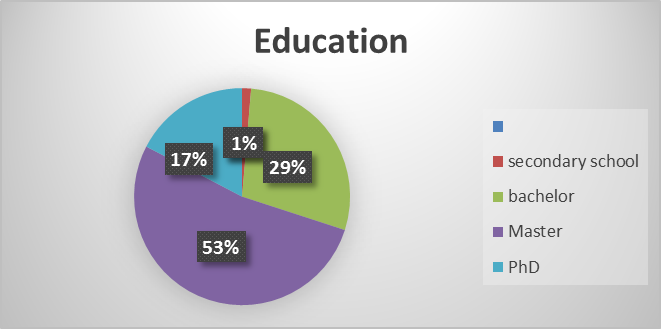
Figure-2. Respondents by the level of education.
In Figure 2, there is presented the percentage of respondents by the level of their education. We can see that the largest percentage of respondents in this survey have a master degree with 53%. 29% of respondents have a bachelor degree, 17% have a PhD degree and only 1% of our respondents have the level of their education secondary school.
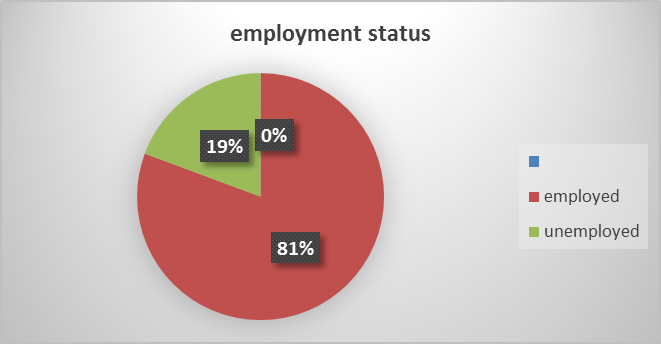
Figure-3. Respondents by employment status.
Figure 3 show us the percentage of respondents by the employment status. Of the total number of respondents, 81% are employed and only a small percentage of 19% are unemployed.
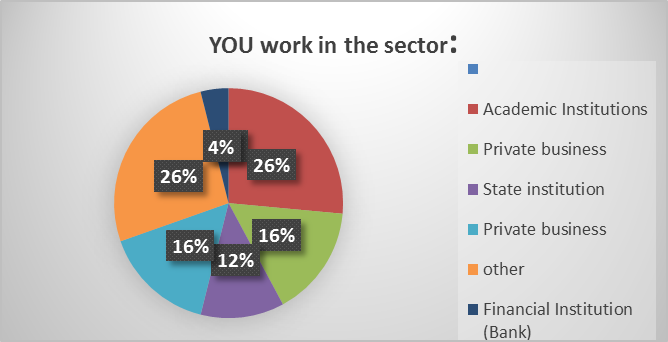
Figure-4. Respondents by the sector the work.
In the Figure 4 we present the number of respondents based on the sector that they work or have worked before, 26% of respondents work in Academic Institutions, 26 % have chosen the option ‘other’, 16 % of the respondents work in private business; 12% of them work in state Institutions; 16% work in their own business, 4% of the respondents work in Banks.
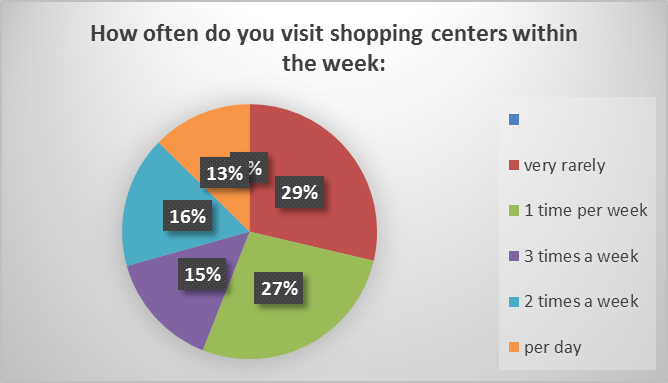
Figure-5. Frequency of shopping malls by respondents.
In the Figure 5 it is presented how often respondents visit shopping centres within a week. 27% visit once per week, 29% very rarely, 16% of the respondents visit the shopping centres twice a weekend, and 13% visit them every day.
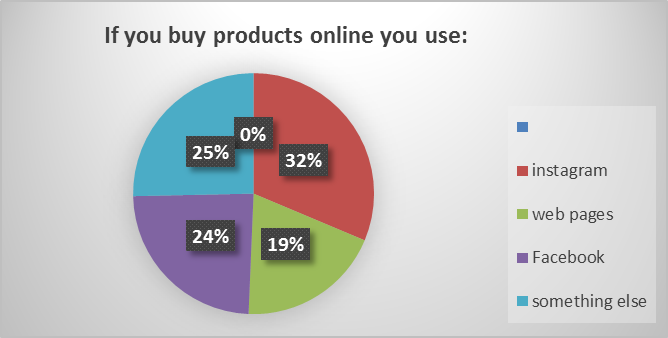
Figure-6. The channels through which respondents buy online.
In Figure 6 we present the channels mostly used by the respondents to shop online, including 24% by Facebook, 19% of the respondents use web pages to shop online, 32% of the respondents use Instagram and 25% choose the option other to shop online.
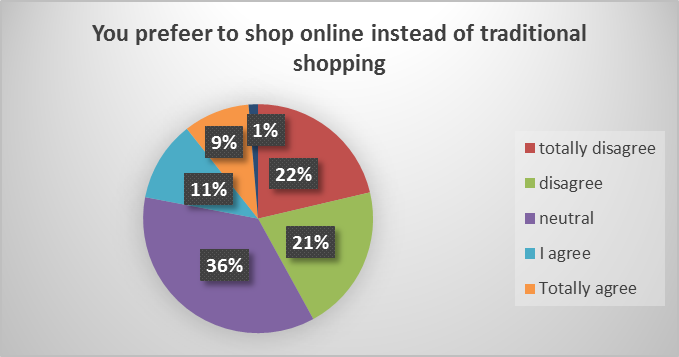
Figure-7. The preferences to shop online instead of traditional shopping.
In the Figure 7 it is presented the desire of respondents to buy online instead of traditional shopping. In the question with Likert Scale from totally disagree to totally agree, 36% of respondents chose neutral, 21% of them choose the option disagree, 22% totally disagree, 9 % totally agree and 11% agree.
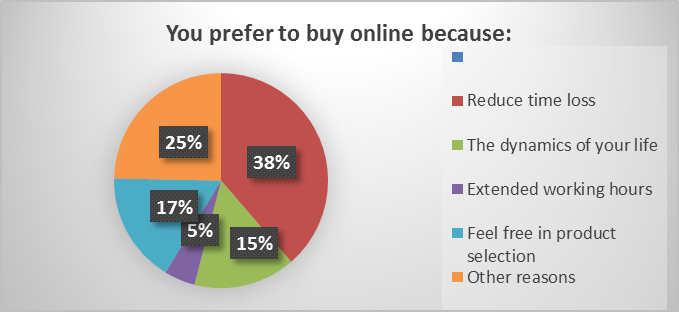
Figure-8. Main reasons why respondents prefer to buy online.
In the Figure 8 we can see that the largest percentage of respondents from 38% prefer to buy online because this opportunity reduce time loss for them, 25% choose the option ‘other’, 17% feel free in product selection, 5% of them choose the option extended working hours.
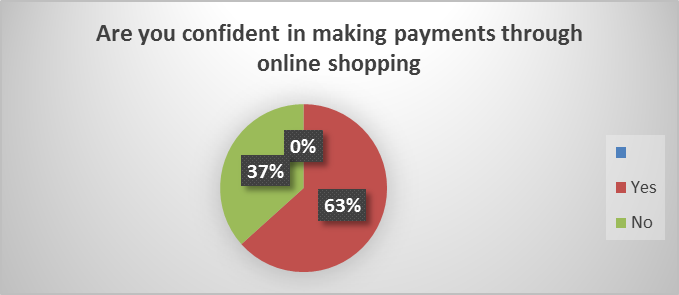
Figure-9. Respondents confidence in making payments through online shopping.
In the Figure 9 we presented the question if they are confident in making payment through online shopping when 63% of the respondents choose the option yes and 37% of them choose the option no.
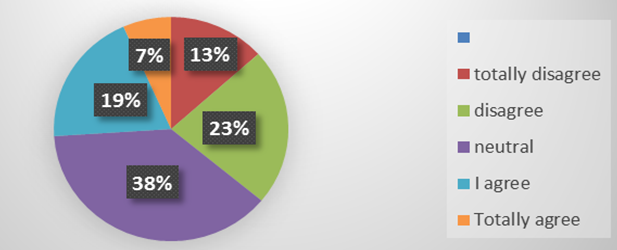
Figure-10. You feel secure when shopping online.
In the Figure 10 it is represented the securement of respondents when shopping online, we can see that 38% of respondents choose the option neutral, 23% choose the option disagree, 13% totally disagree, 19% agree and only 7% of respondents totally agree with the statement that they feel secure when shopping online.
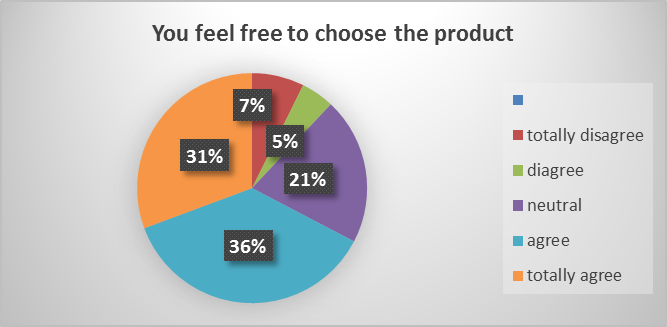
Figure-11. Respondents feeling free to choose the product.
In Figure 11 in the statement that respondents feel free to choose the product, we can see that 36% of respondents choose the option agree, 31% choose the option totally agree, 21% neutral, 5% disagree and only 7% of respondents totally disagree.
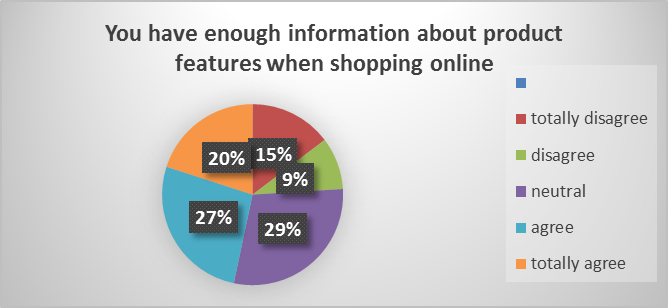
Figure-12. You have enough information about product features when shopping online
In the Figure 12 we can see that 27% of respondents choose the option agree, 20% choose the option totally agree, 29% neutral, 9% disagree and 15% of respondents totally disagree in the statement you have enough information about product features when shopping online.
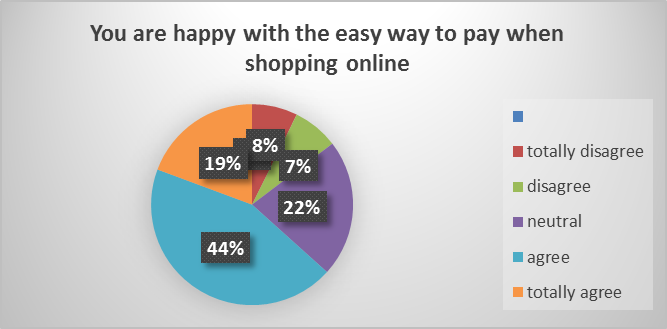
Figure-13. You are happy with the easy way to pay when shopping online
In the Figure 13 we can see that 44% of respondents choose the option agree, 19% choose the option totally agree, 22% neutral, 7% disagree and 8% of respondents totally disagree about the statement you are happy with the easy way to pay when shopping online.
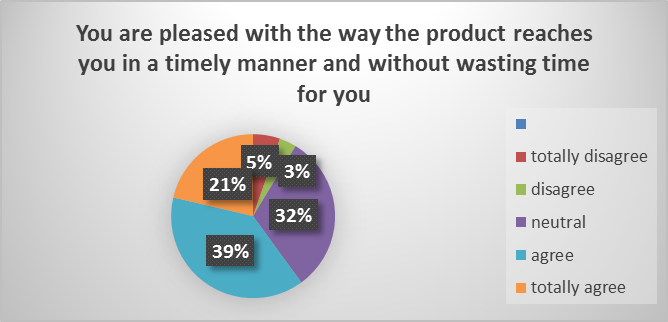
Figure-14.You are pleased with the way the product reaches you in a timely manner and without wasting time for you.
In the Figure 14 we can see that 39% of respondents choose the option agree, 21% choose the option totally agree, 32% neutral, 3% disagree and 5% of respondents totally disagree with the statement you are pleased with the way the product reaches you in a timely manner and without wasting time for you.
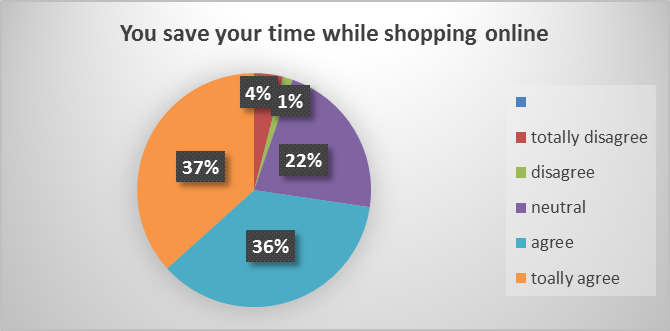
Figure-15. You save your time while shopping online.
In Figure 15 we can see that 36% of respondents choose the option agree, 37% choose the option totally agree, 22% neutral, 1% disagree and 4% of respondents totally disagree with the statement you save your time while shopping online.
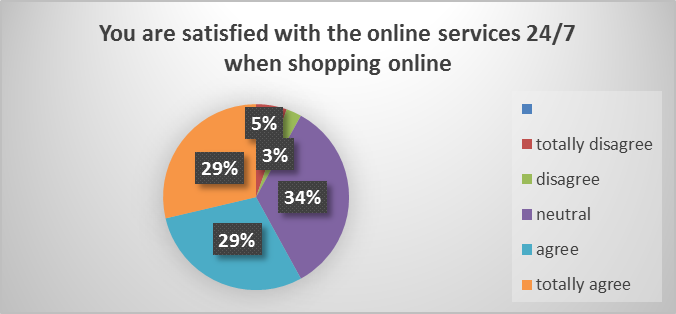
Figure-16. You are satisfied with the online services 24/7 when shopping online
In Figure 16 can see that 29% of respondents choose the option agree, 29% choose the option totally agree, 34% neutral, 3% disagree and 5% of respondents totally disagree with the statement you are satisfied with online services 24/7 when shopping online.
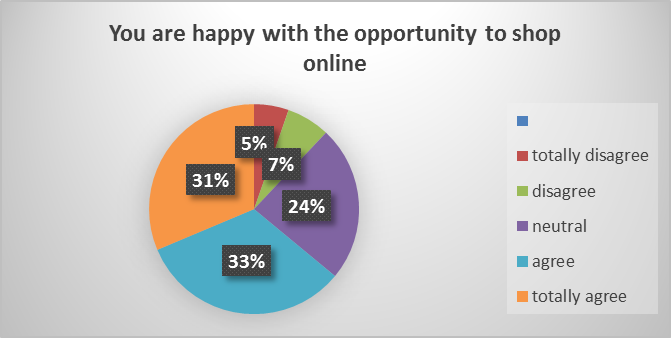
Figure-17. You are happy with the opportunity to shop online
In the Figure 17 we can see that 33% of respondents choose the option agree, 31% choose the option totally agree, 24% neutral, 7% disagree and 5% of respondents totally disagree with the statement you are happy with the opportunity to shop online.
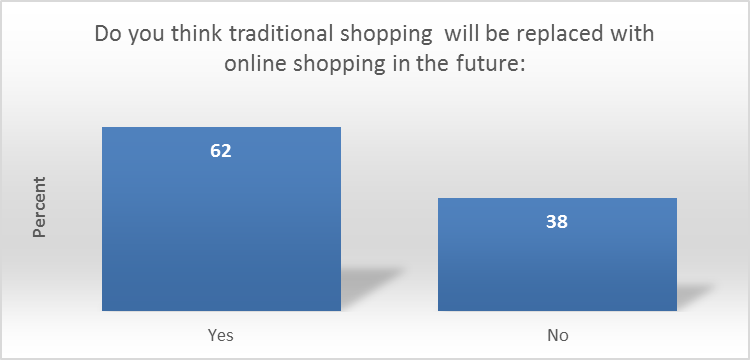
Figure-18. Do you think traditional shopping will be replaced with online shopping in the future
In the Figure 18 is presented the opinion of the respondents regarding traditional shopping vs. Online shopping when 62% of respondents choose the option yes that means traditional shopping will be replaced with online shopping in the future, and 38% of respondents choose the option ‘no’.
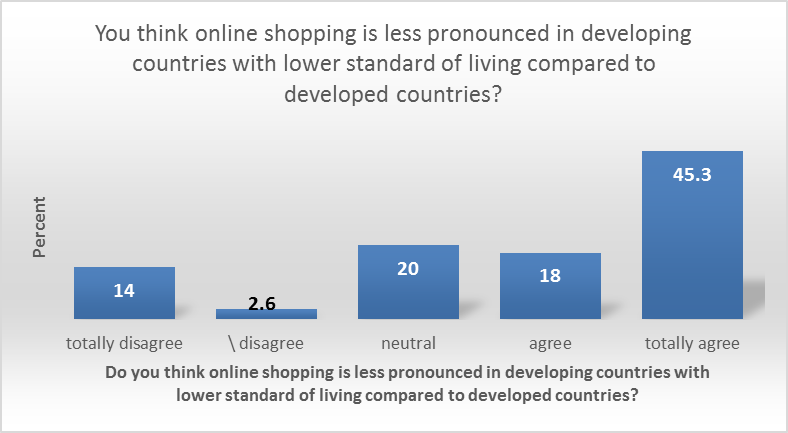
Figure-19. You think online shopping is less pronounced in developing countries with lower standard of living compared to developed countries?
From the Figure19 we can see that 18 % of respondents choose the option agree, 45.3% choose the option totally agree, 20% neutral, 2.6% disagree and 14% of respondents totally disagree.
Do you buy products online: |
Total |
|||
YES |
NO |
|||
| employment status | Employed | 164 |
78 |
242 |
| unemployed | 50 |
8 |
58 |
|
| Total | 214 |
86 |
300 |
|
In the Table 1 the cross tabulation table – employment status, we can see that from the total respondents of 300, 242 of them are employed and 58 are unemployed. From the employed respondents 164 of them choose the option yes that means that they buy products online and 78 of them choose no that means that they do not buy online. 58 of the respondents are unemployed and 50 of them respond that buy online and 8 of them do not boy online.
Value |
Df |
Asymptotic Significance (2-sided) |
Exact Sig. (2-sided) |
Exact Sig. (1-sided) |
|
| Pearson Chi-Square | 7.778a |
1 |
.005 |
||
| Continuity Correction b | 6.903 |
1 |
.009 |
||
| Likelihood Ratio | 8.703 |
1 |
.003 |
||
| Fisher's Exact Test | .006 |
.003 |
|||
| Linear-by-Linear Association | 7.753 |
1 |
.005 |
||
| N of Valid Cases | 300 |
Note: a. 0 cells (0.0%) have expected count less than 5. The minimum expected count is 16.63. |
In Table 2 is presented the Pearson chi-square tests, in our case, the value of the chi square statistic is 7.778. The p-value of Asymptotic Significance (2-sided)” is 0.005. The result is significant the p-value is less than the alpha level (normally .05). In this case, the p-value is smaller than the standard alpha value, so the result is significant – the data suggests that the variables buying online and the level of employment are associated with each other.
The Table 3 the cross Tabulation Table – present the confidence in making payments through online shopping when we can see that from the total numbers of respondents from 146 at age 18-25, 96 of them choose the option yes that means they feel confident in making payments through online shopping and 52 of them choose the option no. From the total number of respondents from 88 at age 26-35, 36 of them choose the option yes and 42 of them choose the option no. From the total number of respondents from 48 aged 36-45, 36 of them choose the option yes and 12 choose the option no. From the respondents aged 46-55, in total 12, 8 of them choose the option yes and 4 of them choose no. and from the respondents aged 56-65, into total 4, and all of them chose the option yes that mean they are confident when making payment through online shopping.
Are you confident in making payments through online shopping: |
Total |
|||
Yes |
No |
|||
| Age | 18-25 | 96 |
52 |
148 |
| 26-35 | 46 |
42 |
88 |
|
| 36-45 | 36 |
12 |
48 |
|
| 46-55 | 8 |
4 |
12 |
|
| 56-65 | 4 |
0 |
4 |
|
| Total | 190 |
110 |
300 |
|
Value |
df |
Asymptotic Significance (2-sided) |
|
| Pearson Chi-Square | 9.972a |
4 |
.041 |
| Likelihood Ratio | 11.331 |
4 |
.023 |
| Linear-by-Linear Association | 1.173 |
1 |
.279 |
| N of Valid Cases | 300 |
Note: a 3 cells (30.0%) have expected count less than 5. The minimum expected count is 1.47. |
From the Table 4 related Pearson chi-square tests we can see that, the value of the chi square statistic is 9.972. The p-value of Asymptotic Significance (2-sided)” is 0.041. The result is significant the p-value is less than the alpha level (normally .05). In this case, the p-value is smaller than the standard alpha value, so the result is significant – the data suggests that the variables Are you confident in making payments through online purchases with age are associated with each other.
| Model Summary | |||||
Model |
R |
R Square |
Adjusted R Square |
Std. Error of the Estimate |
|
1 |
.244a |
.060 |
.047 |
.442 |
|
Note: a. Predictors: (Constant). Age. employment status. Gender. Education |
In Table 5 we interpret the linear regression analysis. Dependent from coefficient of determination R Square equal 0.60 we can collude that the model is significant
Model |
Sum of Squares |
Df |
Mean Square |
F |
Sig. |
|
1 |
Regression |
3.661 |
4 |
.915 |
4.680 |
.001b |
Residual |
57.686 |
295 |
.196 |
|||
Total |
61.347 |
299 |
||||
Note: a. Dependent Variable: Do you buy products online: |
In Table 6 we interpret the ANOVA analysis. The dependent variable that is set in the model is Do you buy products online and predictors are: Age, Employment status, Gender and Education. The model is significant at the level of Significance 0.001.
| Coefficients a | ||||||
| Model | Unstandardized Coefficients |
Standardized Coefficients |
T |
Sig. |
||
B |
Std. Error |
Beta |
||||
| 1 | (Constant) | 1.461 |
.133 |
11.024 |
.000 |
|
| Education | .124 |
.042 |
.192 |
2.969 |
.003 |
|
| employment status | -.183) |
.066 |
-.160) |
-2.778) |
.006 |
|
| Gender | -.071) |
.065 |
-.066) |
-1.099) |
.273 |
|
| Age | -.055) |
.033 |
-.115) |
-1.685) |
.093 |
|
Note: a Dependent Variable: Do you buy products online: |
In Table 7 we interpret the Linear Regression Model. In the regression model we have put the dependent variable online shopping and as dependent variables that may predict the online shopping: (i) education,(ii) employment status.(iii) gender. Regarding the significance of the p-value we can consider that education effect positively the online shopping with p-value 0.003, employment status has also positive impact with p-value less than 0.05 in our case 0.006, but the variable gender has p-value 0.273 that means in our case do not impact the online shopping, age also has p-value 0.093 that means greater than 0.05 that means in our case do not impact the decision for online shopping.
Based on the Pearson Correlation Values presented in Table 8 we can see that employment status with the confidence during payments has a negative value (0.22) which implies a negative relationship between the variables. In other words, employment status is negatively correlated with payment confidentiality. The level of employment is positively correlated with the variable: You feel free to choose the product with coefficients of 0.160 which indicates a weak positive relationship. Confidence in online shopping is negatively correlated with the variable: You feel free to choose the product with coefficient (0. 486), Confidence in online shopping based on Pearson coefficient is negatively correlated with all conceptual variables obtained in the analysis.
The variable: You feel free to choose the product is strongly correlated with the variable: You have enough information about product features when shopping online with a coefficient, 0.725, this variable results in a positive relation with other conceptual variables including variables: You are pleased with the way the product reaches you in a timely manner and without wasting time for you, you save your time while shopping online.
| Correlations | ||||||
| Employment status | Are you confident in making payments through online purchases: | You feel free to choose the product | You have enough information about product features when shopping online | You are pleased with the way the product reaches you in a timely manner and without wasting time for you | You save your time while shopping online | |
| Employment status | 1 |
|||||
| Are you confident in making payments through online shopping: | -.022) |
1 |
||||
| You feel free to choose the product | .106 |
-.486)** |
1 |
|||
| You have enough information about product features when shopping online | -.158)** |
-.401)** |
.725** |
1 |
||
| You are pleased with the way the product reaches you in a timely manner and without wasting time for you | .124* |
-.382)** |
.747** |
.593** |
1 |
|
| You save your time while shopping online | .051 |
-.277)** |
.692** |
.501** |
.721** |
1 |
Note: **. Correlation is significant at the 0.01 level (2-tailed). |
Variable: You have enough information about product features when shopping online is moderately positive with variables: You are happy with the way the product reaches you in a timely manner and without wasting time for you and you save your time while shopping online. The variable you are happy with the way the product reaches you in a timely manner and without wasting time for you is strongly and positively correlated related to the variable you save your time while shopping online with Pearson coefficient, 0.721.
5. Conclusions
The rapid development of science, technology and information technology also influences the lifestyle of a society regardless of the economic development of the country. Overall the Internet and access to online services have led even the poorest economies to change their perceptions of traditional shopping by trying to replace them with online shopping.
Even in our research the results indicate that trends are increasing for online shopping due to the dynamics of life, easy ways of distributing the product, online banking services specifically e-banking, reducing time loss, reducing the stress of visiting all the shops to buy just a few things all these factors make the development of online shopping more and more prevalent in developing countries.
Nowadays individuals within a society are not limited to local brand selection but they can very easily select world brands such as in clothing, accessories, tech through various websites, social networks such as Facebook and Instagram.
During online shopping, shoppers have full convenience in both product selection and confidentiality when making electronic payments. The internet has therefore significantly influenced consumer versus commodity access during online shopping, the speed as products reach the consumer, the price of the product and product and service information.
6. Recommendations
This academic literature-based paper has adapted data analysis to provide valuable recommendations for business in particular and marketing in particular.
Considering the recent development of the Internet and access to the most extensive databases, there is a need for more detailed information of the population for online shopping by local businesses in order to make the consumer feel safe during online shopping as a quality product, price also in the realization of payments. Considering that the largest percentage of the population in Kosovo is young (obtained from the statistical office of Kosovo. www.stat.gov.ks) we can also recommend that we need a promotional platform not only for online sales by businesses, but also guidelines for enhancing consumer safety when making online shopping.
Although the scientific and practical contribution of this study is valuable in particular as it relates to developing countries in the case of Kosovo, it also opens new research paths for future researchers to the fact that they can highly qualify the type of products that are also bought online and categorized based on certain age groups to make possible the correlation between age and the type of products most commonly consumed online. In the end, the research findings are also a good guide for the future of the businesses.
References
Beldad, A., De Jong, M., & Steehouder, M. (2010). How shall I trust the faceless and the intangible? A literature review on the antecedents of online trust. Computers in Human Behavior, 26(5), 857-869. Available at: https://doi.org/10.1016/j.chb.2010.03.013 .
Butler, P., & Peppard, J. (1998). Consumer purchasing on the internet: Processes and prospects. European Management Journal, 16(5), 600-610.
Chocarro, R., Cortiñas, M., & Villanueva, M.-L. (2013). Situational variables in online versus offline channel choice. Electronic Commerce Research and Applications, 12(5), 347-361. Available at: https://doi.org/10.1016/j.elerap.2013.03.004 .
Davis, D. (2012). How many online retailers are there worldwide? Internet retailer. Retrieved from: http://www.internetretailer.com/commentary/experts/how-many-online-retailers-are-there-worldwide/ .
Deloitte. (2015). Omni-channel retail – A Deloitte point of view. Retrieved from: https://www2.deloitte.com/content/dam/Deloitte/se/Documents/technology/Omni-channel-2015.pdf .
Hoque, M. R., Ali, M. A., & Mahfuz, M. A. (2015). An empirical investigation on the adoption of E-commerce in Bangladesh. Asia Pacific Journal of Information Systems, 25(1), 1-24.
Huseynov, F., & Yıldırım, S. (2014). ternet users’ attitudes toward business-to-consumer online shopping: A survey. Information Development, 32(3), 452–465. Available at: 10.1177/0266666914554812.
Kotler, P., Wong, V., Saunders, J., & Armstrong, G. (2005). Principles of marketing: 4ed.
Lee, G., & Lin, H. (2005). Customer perceptions of e-service quality in online shopping. International Journal of Retail and Distribution Management, 33(2), 161-176.
Mathewson, J., & Moran, M. (2016). Outside-in marketing: Using big data to guide your content marketing: Indiana: International Business Machine Corporation.
UNCTAD. (2017). Unctad B2C E-commerce index 2017. UNCTAD report. UNCTAD.