The Influence of Non-Physical Work Environment and Job Characteristics on Employee Performance at PT. Daliatex Kusuma in Bandung
Nidaul Izzah, S.E.1
Novita Rini, S.A.B.2
Baby Poernomo, M.A.3*
1,2,3STIAMI- Institute of Social Sciences and Management, Jakarta-Indonesia |
AbstractThis study aims to determine the influence of non-physical work environment and job characteristics either partially or simultaneously on the performance of employees of PT. Daliatex Kusuma in Bandung. This research is a quantitative and a population study. The subjects were all employees at PT. Daliatex Kusuma with the number of 60 people. Collecting data using questionnaires that have been tested for validity and reliability, while the analysis of data using multiple linear regression analysis. The results showed that: 1) There is a positive and significant influence of non-physical work environment on employee performance indicated from the test results tcount of 4.781 with 0.000 significance. 2) There is a positive and significant influence between characteristics of work on employee performance indicated from the test results of tcount of 2.534 with a significance of 0.000. 3) There is a significant influence between the working environment of non-physical and occupational characteristics simultaneously on the performance of employees. This is indicated by the value Fcount 1,716 with significant value 0.025 and can be written by the regression equation Y = 53.554 + 0.526 (X1) + 0.279 (X2), with the influence of 60.8%, while the remaining 39.2% is influenced by other factors outside the research. |
Licensed: |
|
Keywords: |
|
| (* Corresponding Author) | |
Funding: This research was supported by STIAMI-Institute of Social Sciences and Management, Jakarta-Indonesia. |
Competing Interests: The authors do not have any conflict of interest to declare. |
Acknowledgement:We are thankful to Research and Community Outreach of STIAMI- Institute of Social Sciences and Management which has provided expertise that greatly assisted the research. |
1. Introduction
In this era of competition, companies that cannot meet the demands of customers with special product quality may be eliminated from the competition in the business world. Companies that are actively pursuing quality will surely reap healthy growth in the future. Therefore companies must be prepared to face the pressures to change, they are required to respond in order to survive and succeed in current and future business competition. This must be responded to by management who are required to provide better performance while improving and maintaining quality, and competitiveness to face further pressure. Quality of competent human resources is the principal of the success of the company, but organizational and environmental factors also have a major influence on employees in the work process. In general, companies that are unable to face competition have low product performance and quality. To be able to bring a company organization into a business environment, managers must be responsible for planning and having the competence to make changes as expected. The manager's main task is to motivate employees to improve their performance at a higher level.
According to Sedarmayanti (2011) it reveals that performance is a translation which means the work of a worker, a management process or an organization as a whole, where the results of the work of the person must be shown concretely and can be measured (compared to standards that have been determined). Based on interviews conducted with several employees in the preliminary survey, the following data were obtained:
| Type | 2013 (Meter) | 2014 (Meter) | 2015 (Meter) |
| nGray | 69.483.778 | 67.078.541 | 70.474.530 |
| Fabric | 23.386.962 | 14.270.887 | 39.023.426 |
Source: PT. Daliatex Kusuma (2015). |
From these data, it can be seen the development of gray and fabric production at PT. Daliatex Kusuma fluctuates. This is certainly related to employee performance. According to William Stern in Mangkunegara (2006) employee performance is influenced by two factors, namely individual factors and system factors. Individual factors include the abilities and personality of employees and system factors including work environment, organizational culture, organizational characteristics, job characteristics, leadership and job design.
The work environment can be categorized into two things, namely the non-physical and physical work environment. Non-physical work environment according to Sedarmayanti (2011) is all the conditions that occur that are related to work relationships, both relationships with superiors and relations with fellow colleagues, or relationships with subordinates. The non-physical work environment greatly influences employee performance where if the situation or situation surrounding the employee is conducive to work, the partner is easily invited to work together and the relationship with the boss is good, then the employee will enjoy his job and feel satisfied working at the place.
The physical work environment according to Sedarmayanti (2011) is all physical conditions found around the workplace that can affect employees both directly and indirectly.
For work environment problems, the authors only discuss the non-physical work environment in the company. In terms of non-physical work environment, communication between subordinates and superiors seems awkward. Likewise, relations between employees who are less familiar and work procedures are not neatly organized.
The problem of employee performance is inseparable from what is received by the employee itself. Job characteristic factors can also affect employee performance, if employees feel bored with the task or work that must be done continuously. According to Gunastri (2009) job characteristics are the nature and tasks which include responsibility, type of task and level of satisfaction obtained from the work itself. Jobs that intrinsically provide satisfaction will be more motivating for most people than unsatisfactory work. While seen from the job characteristics, there are still many employees who complain about monotonous work every day and unclear work schedule.
From the background of the research above the authors are interested in conducting research with the title "The Effect of Non-Physical Work Environment and Job Characteristics on Employee Performance study at PT. Daliatex Kusuma in Bandung ".
2. Problem Statement
Based on the explanation from the background regarding the performance of the employees of PT. Daliatex Kusuma, the problems to be discussed are as follows:
How much non-physical work environment influences the performance of employees of PT. Daliatex Kusuma in Bandung?
How much work characteristics affect the performance of employees of PT. Daliatex Kusuma in Bandung?
How much non-physical work environment and characteristics of the work have an effect on the performance of the employees of PT. Daliatex Kusuma in Bandung?
3. Literature Review
3.1. Employee Performance
Mangkunegaraa (2009) says performance is the result of work in quality and quantity achieved by an employee in carrying out his duties in accordance with the responsibilities given to him. Understanding that it can be concluded that the performance of human resources is work performance or work results (output) both quality and quantity achieved by HR unity period of time in carrying out work duties in accordance with the responsibilities given to him. Wibowo (2008) said that performance is about doing work and the results achieved from the work. Ida and Agus (2008) said that performance is the achievement of organizational goals which can be in the form of quantitative or qualitative output, creativity, flexibility, reliability or other things desired by the organization. The emphasis on performance can be both short and long term, also at the level of individuals, groups or organizations. Performance management is a process designed to link organizational goals with individual goals so that both objectives meet. Performance can also be an action or execution of tasks that have been completed by someone within a certain period of time and can be measured.
From some expert opinions it can be concluded that employee performance is the achievement of a work result in the quality and quantity achieved by employees. Therefore human resources are very important to be empowered so that it can become a separate investment for the organization. Every organization has an interest in the best performance that can be produced by a series of systems that apply in the organization.
3.2. Factors Influenced Employee Performance
According to William Stern in Mangkunegara (2006) employee performance is influenced by two factors, individual factors and system factors, namely:
a) Individual factors include the abilities and personality of employees.
b) System factors include work environment, organizational culture, organizational characteristics, job characteristics, leadership and job design.
3.3. Performance Indicators
Employee performance indicators according to Malthis and Jackson (2006) are as follows:
a. Quantity (the amount of work a person can do within one working day)
b. Quality (obedience in procedures, discipline and dedication). The quality of work is measured by employee perceptions of the quality of work produced and the task's perfection of the skills and abilities of employees.
c. Employee reliability (the ability to do the required work with minimum supervision).
d. Presence (attendance is the belief that you will enter work every day and according to working hours).
e. Ability to cooperate (the ability of a workforce to work together with other people in
completing a task and work that has been set so as to achieve maximum usability and results).
3.4. Working Environment
The work environment in a company needs to be considered because there are still many government agencies and private companies that are not conducive this is because the work environment has a direct influence on employees. A conducive work environment can improve employee performance. Nitisemito (2009) argues that the work environment is everything that exists around the workers who can influence themselves in carrying out tasks that are charged.
3.4.1. Physical Working Environment
Sedarmayanti (2011) states that the physical work environment is all physical conditions found around the workplace that can affect employees both directly and indirectly. The physical work environment can be divided into two categories, namely:
- Environment that is directly related to employees (such as: work centers, chairs, tables and so on).
- Intermediary environment or general environment can also be called a work environment that affects human conditions, such as: lighting, temperature, humidity, air circulation, noise, mechanical vibration, odor, color management, decoration, music, security.
3.4.2. Non Physical Working Environment
Furthermore Sedarmayanti (2011) argues that non-physical work environment is all the conditions that occur that are related to work relationships, both relationships with superiors and relations with fellow colleagues, or relationships with subordinates. According to Nitisemito (2009) companies should be able to reflect conditions that support cooperation between supervisors, subordinates and those with the same position status in the company. Conditions that should be created are a family atmosphere of good communication and self-control.
Meanwhile, Wursanto (2009) called it a psychological work environment which defined as "something that concerns the psychological aspects of the work environment". Based on this understanding, it can be said that the non-physical work environment is also called the psychic work environment, that is the situation around the workplace which is non-physical. This kind of work environment cannot be captured directly with the five human senses, but can be felt by its existence. So, the non-physical work environment is a work environment that can only be felt by feelings. Based on the opinion and description, it can be said that the non-physical work environment is a work environment that cannot be captured by the five human senses. However, this can be felt by workers through fellow worker relations and with superiors.
Based on these notions, it can be said that the non-physical work environment is also called the psychic work environment, that is, the conditions around the workplace that are non-physical. This work environment cannot be captured directly with the five human senses, but can be felt by its existence. Based on the description, it can be concluded that the non-physical work environment is a work environment that can only be felt and cannot be captured by the five human senses. This non-physical work environment can be felt by employees through the relationships of fellow employees, subordinates with superiors, and superiors with subordinates.
3.5. Indicators of Non Physical Working Environment
The indicators of the non-physical work environment according to Wursanto (2009) are as follows:1) Work Procedure. It is a series of work procedures that are arranged sequentially, so that the work sequence is formed gradually in completing a job.
2) Work Standards. They are the requirements of duties, functions or behaviors determined by the employer as a target to be achieved by an employee.
3) The responsibility of the supervisor. The responsibility of a supervisor is to arrange employee duties so that they can be done effectively and fairly. The supervisor is also responsible for evaluating employees to ensure the achievement of targets set by the company.
4) Clarity of duties, namely the extent to which the work requires the completion of all work pieces in full and can be recognized by employees. In this case employees are required to understand and be able to carry out their work based on instructions from superiors.
5) Reward system. Reward system or reward system is a program used to identify individual employee achievements, such as achieving goals or projects or using creative ideas.
6) Relationships between employees, namely relationships with harmonious coworkers and without mutual intrigue among fellow coworkers. One of the factors that influence employees staying in one organization is the existence of a harmonious relationship between coworkers.
3.6. Types of Non Physical Working Environment
Several types of non-physical work environments according to Wursanto (2009) namely:
1) Employees' secure feeling. It is a sense of security from various hazards that can threaten the employee's self-condition. The safe feeling consists of the following:
(a) A sense of security from hazards that may arise when carrying out their duties.
(b) A sense of security from termination of employment that could threaten the livelihood of themselves and their families.
(c) A sense of security from forms of intimidation or accusations from suspicion among employees.
2) Employee loyalty is the attitude of employees to be loyal to the company or organization and to the work that is the responsibility. This loyalty consists of two kinds, namely loyalty that is vertical and horizontal. Vertical loyalty is loyalty between subordinates and superiors or vice versa between superiors and subordinates. This loyalty can be formed in various ways, namely:
(a) Visits or hospitality to employees' homes by the leadership or vice versa, which can be realized in the form of activities such as social gathering.
(b) Leaders' participation in helping employee difficulties in various problems.
(c) Defending the interests of employees as long as they are within the applicable legal corridors.
(d) Protect subordinates from various forms of threats. Meanwhile, the loyalty of subordinates and superiors can be formed with activities such as open houses, giving opportunities to subordinates to stay in touch with the leadership, especially at certain times such as religious holidays for example Eid Mubarak, Christmas or other days. Horizontal loyalty is loyalty between subordinates or between leaders. This horizontal loyalty can be realized with activities such as visiting fellow employees, joint sightseeing, or other activities.
3) Employee satisfaction is a feeling of satisfaction that arises in employees related to the implementation of work. This feeling includes satisfaction because their needs are met, their social needs can run well, and psychological needs are also fulfilled.
3.7. Job Characteristic
According to Gunastri (2009) job characteristics are the nature and tasks which include responsibility, type of task and level of satisfaction obtained from the work itself. Jobs that intrinsically provide satisfaction will be more motivating for most people than unsatisfactory work. Subyantoro (2009) argues that job characteristics are the nature of the task which includes responsibility, type of task and level of satisfaction obtained from the work itself.
Whereas according to Stoner (2006)"
“Job characteristica re the attributes of the employee’s task and include the amount of responsibility, the variety of task, and the extent to which the job it self has characteristics that people find statisfuing. A job is intrinsically statisfying will be more motivating for many people than a job that is nol.
3.8. Job Indicator Characteristic
Basically, each job must have its own characteristics. Between one job and another job is possible to have similarities in characteristics but it is ensured that the majority of jobs have different characteristics. Panudju (2003) states that each job has five characteristics, namely:
a) Skill variety (diversity of skills) that allows employees to carry out different tasks and often requires different skills. Jobs that demand diverse skills are seen by employees as more challenging because they cover various types of skills. Jobs such as this also eliminate the routines that arise from every repetitive activity. The diversity of skills creates a feeling of greater competence for employees, because it can do different types of work in different ways.
b) Task identity that allows employees to carry out their full work. Employees who individually work a small part of the job cannot identify the employee's efforts. If the task is expanded to produce an overall performance or part that can be identified, the task identity has been formed.
c) Task significance (Significant task) which refers to how much impact the work has on others, as perceived by society. The impact may be on other people in the organization concerned or that impact on other parties outside the company. The important thing is that employees believe that they have done something important in the organization or society.
d) Autonomy (authority and responsibility) which is the characteristic of work that gives employees certain freedom and control over decisions related to their work. With freedom, employees are able to manage their work without pressure.
e) Job feedback that refers to information tells employees how well the work performance has been achieved during the work. Feedback arises from the work itself, the boss and other employees. Furthermore, employees need to know how well their achievements in the employee's timeframe are as often as possible because employees acknowledge that the achievements are indeed different and one way to be able to make adjustments is to know how employees are doing now.
3.9. Hypothesis
Based on the problems raised by the literature review, the hypothesis in this study are:
H1 = It is assumed that there is influence from the non-physical work environment on the performance of PT. Daliatex Kusuma.
H2 = Allegedly there is an influence from the Characteristics of Workers on the performance of employees of PT. Daliatex Kusuma.
H3 = It is assumed that there is influence from the Non-Physical and Characteristic Work Environment on the performance of the employees of PT. Daliatex Kusuma.
4. Research Methods
The research method used is the survey method. The primary data in this study are data obtained by field surveys through distributing questionnaires to respondents. The sample in this study is the same as the population, namely 60 employees of PT. Daliatex Kusuma in Bandung.
4.1. Characteristics of Respondents
The study was conducted on 60 employees of PT. Daliatex Kusuma. In the description of the research subjects explained in detail the characteristics of respondents seen from gender, marital status, age, education, and length of work. Below is the identity of the respondents from the sixty respondents.
4.1.1. Gender
Based on the questionnaire that has been done, it has been obtained the results of 35 male respondents (58.3%) and 25 female respondents (41.7%), which can be explained in the table as follows:
Number |
Percent |
Valid Percent |
Cumulative Percent |
||
| Valid | Male | 35 |
58.3 |
58.3 |
58.3 |
| Female | 25 |
41.7 |
41.7 |
100.0 |
|
| Total | 60 |
100.0 |
100.0 |
||
Source: Data analysis by SPSS 19. |
4.1.2. Marriage Status
Based on the questionnaire that has been carried out, 23 respondents were married (38.3%) and 37 unmarried respondents (61.7%), which can be explained in the table as follows:
Frequency |
Percent |
Valid Percent |
Cumulative Percent |
||
| Valid | Married | 23 |
38.3 |
38.3 |
38.3 |
| Unmarried | 37 |
61.7 |
61.7 |
100.0 |
|
| Total | 6 0 |
100.0 |
100.0 |
||
Source: Data analysis by SPSS 19. |
4.1.3. Age
Based on the data below it can be seen that the respondents have different ages, but at most of the respondents aged between 35-50 years (38.3%), and the lowest is age <25 years (10.0%), which can be explained in table as follows:
Frequency |
Percent |
Valid Percent |
Cumulative Percent |
||
| Valid | < 25 |
6 |
10.0 |
10.0 |
10.0 |
25 – 34 |
21 |
35.0 |
35.0 |
45.0 |
|
35 – 50 |
23 |
38.3 |
38.3 |
83.3 |
|
> 50 |
10 |
16.7 |
16.7 |
100.0 |
|
Total |
60 |
100.0 |
100.0 |
Source: Data analysis by SPSS 19. |
4.1.4. Education
Based on the data below it can be seen that the respondents had different education, but at most of the respondents had high school education (48.3%), and the lowest were those with a Bachelor degree (18.3%), which can be explained in the table as follows:
Frequency |
Percent |
Valid Percent |
CumulativePercent |
||
| Valid | Senior High | 29 |
48.3 |
48.3 |
48.3 |
| Diploma 3 | 20 |
33.3 |
33.3 |
81.7 |
|
| Bachelor | 11 |
18.3 |
18.3 |
100.0 |
|
| Total | 60 |
100.0 |
100.0 |
||
Source: Data analysis by SPSS 19. |
4.1.5. Working Period
Based on the data below, it can be seen that the respondents had different years of service, but most of the respondents had a working period of <1 year (40.0%), and the lowest was those with a working period of 4 - 5 years (3.3%) in the table as follows:
Frequency |
Percent |
Valid Percent |
Cumulative Percent |
||
Valid |
<1 |
24 |
40.0 |
40.0 |
40.0 |
2 – 3 |
22 |
36.7 |
36.7 |
76.7 |
|
4 – 5 |
2 |
3.3 |
3.3 |
80.0 |
|
> 5 |
12 |
20.0 |
20.0 |
100.0 |
|
Total |
60 |
100.0 |
100.0 |
||
Source: Data analysis by SPSS 19. |
4.2. Data Description
Descriptive statistics from the data above can be seen as follows:
Non Physical Working Environment |
Job Characteristic |
Employee Performance |
||
| N | Valid | 60 |
60 |
60 |
| Missing | 0 |
0 |
0 |
|
| Std. Error of Mean | 1.341 |
.848 |
.937 |
|
| Minimum | 41 |
16 |
19 |
|
| Maximum | 85 |
44 |
48 |
|
Source: Data analysis by SPSS 19. |
Descriptive statistics show that data from 60 respondents are all valid and there are no missing. Assessment is obtained based on the average answer to the questionnaire formed from variable indicators. The answer to the question raised by the researcher in achieving a non-physical work environment has a mean value of 1,341 from a maximum value of 85. Job Characteristics Achievement has a mean value of 848 from a maximum value of 44. Achievement of Employee Performance has a mean value of 937 from a maximum value of 48.
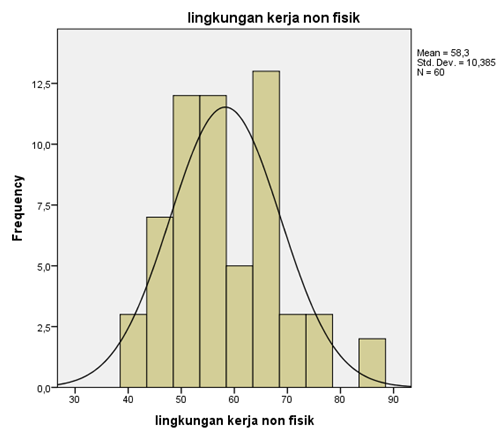
Descriptive statistics for Non-Physical Work Environment variables (X1), it is known that from the total respondents' answers to each question item the minimum score is 41 and the maximum is 85, and the average is 58.3 with a standard deviation of 10.385, so that the distribution of data on Non-Physical Work Environment variables (X1) is normally distributed.
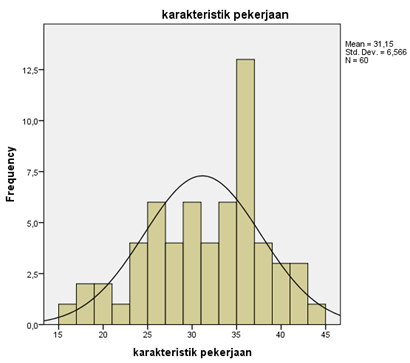
Descriptive statistical results for Job Characteristics variables (X2), it is known that from the total respondents' answers to each question item the total score is a minimum of 16 and a maximum of 44, and an average of 31.15, with a standard deviation of 6.566, so that the distribution of data on the Job Characteristics variable (X2) is normally distributed.
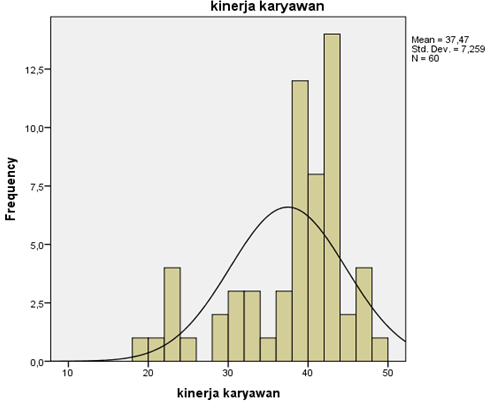
Descriptive statistical results for Employee Performance variables (Y), it is known that from the total respondents' answers to each question item the minimum score is 19 and a maximum of 48, and an average of 37.47, with a standard deviation of 7.259, so that the data distribution of Employee Performance variable (Y) is normally distributed.
4.2.1. Test of Research Instruments
In the results of this study, a research instrument test was conducted, which consisted of validity and reliability tests, both of which were very important to determine the expected results.
4.3. Test Validity
For this research, validity tests have been carried out using the SPSS 19 program, which has obtained the following results:
4.3.1. Test the Validity of Variables for Non Physical Work Environment (X1)
Item |
Scale Mean if Item Deleted |
Scale Variance if Item Deleted |
Corrected Item-Total Correlation |
Cronbach's Alpha if Item Deleted |
P1 |
113.07 |
404.775 |
.604 |
.732 |
P2 |
113.10 |
409.346 |
.529 |
.735 |
P3 |
113.05 |
414.048 |
.456 |
.738 |
P4 |
112.97 |
414.846 |
.449 |
.739 |
P5 |
113.20 |
406.400 |
.577 |
.733 |
P6 |
113.13 |
406.762 |
.565 |
.733 |
P7 |
113.10 |
404.702 |
.595 |
.732 |
P8 |
113.40 |
404.142 |
.554 |
.732 |
P9 |
113.23 |
400.826 |
.663 |
.729 |
P10 |
113.33 |
401.243 |
.601 |
.729 |
P11 |
113.03 |
405.592 |
.595 |
.732 |
P12 |
113.15 |
400.570 |
.637 |
.729 |
P13 |
113.23 |
411.504 |
.470 |
.737 |
14 |
113.10 |
409.346 |
.529 |
.735 |
P15 |
113.33 |
406.768 |
.464 |
.734 |
P16 |
113.17 |
411.090 |
.437 |
.737 |
P17 |
113.30 |
409.197 |
.422 |
.736 |
| Source: Data analysis using SPSS 19. |
The r-table value can be obtained through df (degree of freedom) = n - 2, where k is a question item in a variable, and n is the number of respondents. Then df = 60 - 2 = 58. Table r product-moment two tailed tests (see appendix) shows that at df 58 with alpha 5%, it is obtained rtable is 0.254. The results above can be summarized as follows:
1. r count P1 is 0,604 > r table 0,254, valid conclusion
2. r count P2 is 0,529 > r table 0,254, valid conclusion
3. r count P3 is 0,456 > r table 0,254, valid conclusion
4. r count P4 is 0,449 > r table 0,254, valid conclusion
5. r count P5 is 0,577 > r table 0,254, valid conclusion
6. r count P6 is 0,565 > r table 0,254, valid conclusion
7. r count P7 is 0,595 > r table 0,254, valid conclusion
8. r count P8 is 0,554 > r table 0,254, valid conclusion
9. r count P9 is 0,663 > r table 0,254, valid conclusion
10.r count P10 is 0,601 > r table 0,254, valid conclusion
11.r count P11 is 0,595 > r table 0,254, valid conclusion
12. r count P12 is 0,637 > r table 0,254, valid conclusion
13. r count P13 is 0,470 > r table 0,254, valid conclusion
14. r count P14 is 0,529 > r table 0,254, valid conclusion
15. r count P15 is 0,464 > r table 0,254, valid conclusion
16. r count P16 is 0,437 > r table 0,254, valid conclusion
17. r count P17 is 0,422 > r table 0,254, valid conclusion
Based on the results of this calculation, it can be concluded that 17 question variables have r count which is greater than the rtable value, which means that all questions are valid.
4.3.2. Test the Validity of Variable Job Characteristics (X2)
Item |
Scale Mean if Item Deleted |
Scale Variance if Item Deleted |
Corrected Item-Total Correlation |
Cronbach's Alpha if Item Deleted |
P18 |
58.97 |
157.185 |
.644 |
.753 |
P19 |
59.00 |
151.492 |
.722 |
.743 |
P20 |
59.10 |
156.431 |
.575 |
.754 |
P21 |
58.93 |
156.267 |
.525 |
.755 |
P22 |
58.62 |
154.376 |
.701 |
.748 |
P23 |
58.82 |
151.712 |
.773 |
.742 |
P24 |
58.58 |
149.196 |
.803 |
.737 |
P25 |
58.75 |
157.987 |
.536 |
.757 |
P26 |
58.78 |
154.579 |
.706 |
.748 |
| Source: Data are processed using SPSS 19. |
The r-table value can be obtained through df (degree of freedom) = n - 2, where k is a question item in a variable, and n is the number of respondents. Then df = 60 - 2 = 58. Table r product-moment two tailed tests (see appendix) shows that at df 58 with alpha 5%, obtained rtable is 0.254. The results above can be summarized as follows:
- r count P18 is 0,644 > r table 0,254, valid conclusion
- r count P19 is 0,722 > r table 0,254, valid conclusion
- r count P20 is 0,575 > r table 0,254, valid conclusion
- r count P21 is 0,525 > r table 0,254, valid conclusion
- r count P22 is 0,701 > r table 0,254, valid conclusion
- r count P23 is 0,773 > r table 0,254, valid conclusion
- r count P24 is 0,803 > r table 0,254, valid conclusion
- r count P25 is 0,536 > r table 0,254, valid conclusion
- r count P26 is 0,706 > r table 0,254, valid conclusion
- r count P27 is 0,714 > r table 0,254, valid conclusion
- r count P28 is 0,694 > r table 0,254, valid conclusion
- r count P29 is 0,793 > r table 0,254, valid conclusion
- r count P30 is 0,747 > r table 0,254, valid conclusion
- r count P31 is 0,684 > r table 0,254, valid conclusion
- r count P32 is 0,567 > r table 0,254 valid conclusion
- r count P33 is 0,615 > r table 0,254, valid conclusion
- r count P34 is 0,670 > r table 0,254, valid conclusion
- r count P35 is 0,643 > r table 0,254, valid conclusion
- r count P36 is 0,505 > r table 0,254, valid conclusion
Based on the results of this calculation, it can be concluded that 9 question variables have r count which is greater than the rtable value, which means that all questions are valid.
4.3.3. Test the Validity of Variables for Employee Performance (Y)
Item |
Scale Mean if Item Deleted |
Scale Variance if Item Deleted |
Corrected Item-Total Correlation |
Cronbach's Alpha if Item Deleted |
P27 |
71.22 |
190.579 |
.714 |
.747 |
P28 |
71.38 |
188.376 |
.694 |
.745 |
P29 |
71.32 |
185.644 |
.793 |
.739 |
P30 |
71.00 |
184.237 |
.747 |
.738 |
P31 |
71.20 |
190.739 |
.684 |
.748 |
P32 |
71.55 |
192.964 |
.567 |
.753 |
P33 |
71.10 |
194.092 |
.615 |
.753 |
P34 |
71.18 |
188.423 |
.670 |
.745 |
P35 |
71.07 |
193.656 |
.643 |
.752 |
P36 |
70.85 |
198.943 |
.505 |
.761 |
| Source: Data analysis using SPSS 19. |
The r-table value can be obtained through df (degree of freedom) = n - 2, where k is a question item in a variable, and n is the number of respondents. Then df = 60 - 2 = 58. Table r product-moment two tailed tests (see appendix) shows that at df 58 with alpha 5%, obtained rtable is 0.254. The results above can be summarized as follows:
Based on the results of this calculation, it can be concluded that 10 items of variables have r count which is greater than the rtable value, which means that all questions are valid.
4.3.4. Reliability Test
To test the reliability of the instrument used the Cronbach Alpha reliability coefficient whose calculation uses reliability procedures with the SPSS for Windows Version 19 program. The aim is to assess the stability of the size and consistency of respondents in answering the questionnaire. If the cronbach alpha value is greater than 0.60, the questionnaire can be said to fulfill the concept of reliability, whereas if the cronbach alpha value is smaller than 0.60 then the questionnaire does not fulfill the concept of reliability so the question cannot be used as a measuring instrument of research.
Based on the data collected from the research questionnaire, the following are presented the results of the reliability test for the Non Physical Work Environment variable (X1) in this study:
Reliability Statistics |
|
Cronbach's Alpha |
N of Items |
.871 |
17 |
| Source: Data analysis using SPSS 19. |
Based on the table above it can be concluded that the construct reliability of the answer to the question and consistent in the answers to the questions on the respondent's behavior variable is good. This can be proven by looking at the value of Cronbach’Alpha of 0.871> 0.60, which means that all the answers to questions representing non-physical work environment variables are reliable.
| Reliability Statistics | |
| Cronbach's Alpha | Cronbach's Alpha |
| .874 | .874 |
| Source: Data analysis using SPSS 19. |
Based on the table above it can be concluded that the construct reliability of the answer to the question and consistent in the answers to the questions on the respondent's behavior variable is good. This can be proven by looking at the value of Cronbach'Alpha of 0.874> of 0.60, which means that all the answers to the questions that represent the variable job characteristics are reliable.
Reliability Statistics |
|
Cronbach's Alpha |
N of Items |
.886 |
10 |
| Source: Data analysis using SPSS 19. |
Based on the table above it can be concluded that the construct reliability of the answer to the question and consistent in the answers to the questions on the respondent's behavior variable is good. This can be proven by looking at the value of Cronbach’Alpha of 0.886> of 0.60, which means that all the answers to questions that represent the variable employee performance are reliable.
4.4. Test Requirements Analysis
Data analysis was performed using correlation. Before analyzing the data to find the influence between the variables used for the study, an analysis prerequisite test was conducted which included:
4.4.1. Data Normality Test
According to Ghozali (2011) the normality test aims to test whether in the regression model, the residual confounding variable has a normal distribution, if this assumption is violated then the statistical test becomes invalid for a small sample number. A good regression model is close to normal distribution. This test was carried out with the help of the program for society science (SPSS) Normal Probability Plot (NPP) Method.
The Normal Probability (NPP) method is done by comparing real data with the normal (automatic with computer) distribution data. A data is said to be normally distributed if the data line follows a normal line. To test whether in the regression model, the dependent variable (bound) and the independent variable (free) both have a normal distribution can be seen on the Histogram graph or the normal graph P-P plot. Data distribution must be normal or near normal to meet normality assumptions.
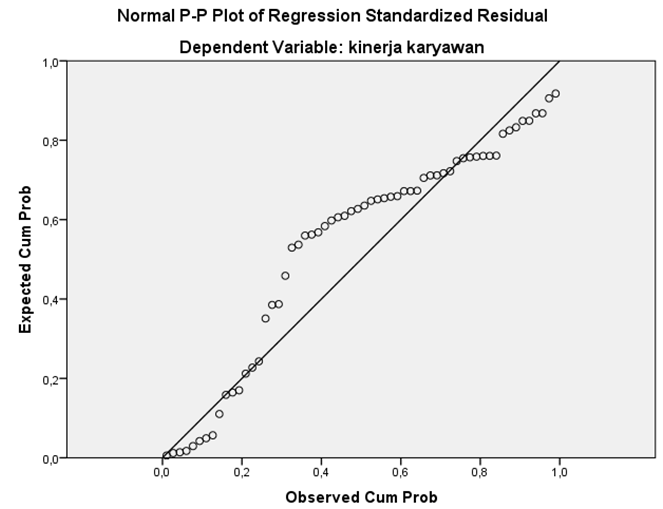
From Figure 4.5 it can be seen that there is a point that spreads around the line and follows the diagonal line. This proves that the residual value is normal.
4.4.2. Homogeneity Test
Tests for variance homogeneity is done using homogeneity tests in the reliability statistics table with the help of SPSS 19 for Windows in multiple regression analysis to obtain good results the variance in the disturbance component must be the same (heterocedasticity). If this assumption cannot be met, the data is homogeneous.
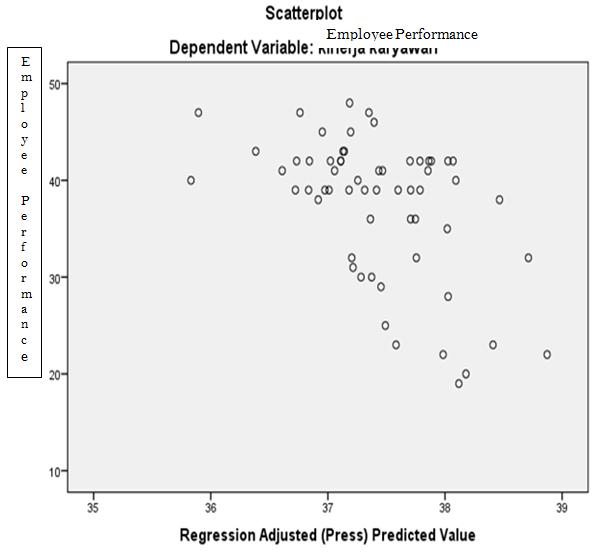
From Figure 4.6 it can be seen that the points spread randomly do not form a clear pattern, such as wavy, narrowed and then widened. Besides these points spread above and below the numbers on the Y axis, it can be concluded that there is no problem of heteroscedasticity in the regression model.
4.5. Hypothesis Testing
The hypothesis testing in this study can be described below:
4.5.1. Simple Linear Regression Test
Simple linear regression calculations are used to predict the magnitude of the relationship between the independent variable, namely the Non-Physical Work Environment (X1) and the dependent variable, namely Employee Performance (Y), and the independent variable, namely the Job Characteristics (X2) with variables dependent (dependent) namely Employee Performance (Y). The results of a simple linear regression can be seen below:
| Model | Unstandardized Coefficients |
Standardized Coefficients |
||||
B |
Std. Error |
Beta |
T |
Sig. |
||
1 |
(Constant) | 39.591 |
7.455 |
5.311 |
.000 |
|
| Non- physical working environmentk | .550 |
.079 |
.586 |
6.961 |
.000 |
|
| Source: Primary Data are processed using SPSS 19. |
Based on this output coefficient, the hypothesis will be partially proven, the beta effects generated, and the formation of the regression equation. The linear regression equation in this study can be formed from the results of Coeficient on the Standardized Coefficients column as follows:
![]()
The meaning is:
α = 39,591 which means if the variable X1 (Non Physical Work Environment has a value of 0 (none), the variable Y (Employee Performance) has a value of 39,591.
β = 0.586 which means that if each increase in variable X1 (Non Physical Work Environment) is equal to one unit, it will increase the variable Y (Employee Performance) by 0.586 units with a constant of 39,591 and vice versa.
| Model | Unstandardized Coefficients |
Standardized Coefficients |
T |
Sig. |
||
B |
Std. Error |
Beta |
||||
1 |
(Constant) | 39.465 |
4.612 |
8.557 |
.000 |
|
| Job Characteristic | .180 |
.069 |
.378 |
2.619 |
.000 |
|
Note: a. Dependent Variable: Employee Performance |
Based on this output coefficient, the hypothesis will be partially proven, the beta effects generated, and the formation of the regression equation. The linear regression equation in this study can be formed from the results of Coefficient on the Standardized Coefficients column as follows:
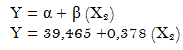
The meaning is:
α = 39,465 which means that if the variable X2 (Job Characteristics) has a value of 0 (none), the variable Y (Employee Performance) has a value of 39,465.
Β = 0.378 which means that if every increase in variable X2 (Job Characteristics) is equal to one unit, it will increase the variable Y (Employee Performance) by 0.378 units with a constant of 39.465 and vice versa.
4.5.2. Test of Multiple Linear Regression
The calculation of multiple linear regression is used to predict the magnitude of the relationship between the dependent variables, namely Employee Performance (Y), with the independent variable (independent) namely the Non Physical Work Environment (X1), and Job Characteristics (X2). The results of multiple linear regression can be seen below:
| Model | Unstandardized Coefficients |
Standardized Coefficients |
t |
Sig. |
||
B |
Std. Error |
Beta |
||||
1 |
(Constant) | 53.554 |
6.818 |
7.854 |
.000 |
|
| Non- physical working environment | .548 |
.115 |
.526 |
4.781 |
.000 |
|
| Job Characteristic | .283 |
.112 |
.279 |
2.534 |
.000 |
|
Note: a. Dependent Variable: employee performance. |
Based on this output coefficient, hypotheses will be partially proven, beta effects generated, and formation of regression equations. The linear regression equation in this study can be formed from the results of Coeficient in the Standardized Coefficients column as follows:
The meaning is:
α = 53,554 which means if the variable X1 (non-physical work environment) has a value of 0 (none) then the variable Y (employee performance) has a value of 53,554.
β = 0.526 which means that if every increase in variable X1 (non-physical work environment) is equal to one unit then it will increase the variable Y (Employee performance) by 0.526 units with constants 53.554 and vice versa.
α = 53,554 which means that if every variable X2 (Job characteristics) has a value of 0 (none), the variable Y (Employee performance) has a value of 53,554.
β = 0.279 which means that if every increase in variable X2 (Job characteristics) is equal to one unit, it will increase the variable Y (Employee performance) by 0.279 units with constants 53.554 and vice versa.
4.6. Testing the Hypothesis t (t Test)
Testing this hypothesis to find out whether the independent variables have their own influence on the dependent variable and which independent variable (free) is the most dominant influence on Employee Performance.
| Model | Standardized Coefficients |
t |
Sig. |
|
Beta |
||||
1 |
(Constant) | 7.854 |
.000 |
|
| Non-physical working environment | .526 |
4.781 |
.000 |
|
| Job Characteristic | .279 |
2.534 |
.000 |
|
| Note: a. Dependent Variable: employee performance. Source: Primary Data Primer are processed using SPSS 19. |
From the results of the t test from table 4.20 shows that there are 2 independent variables (X) that have a significant influence on the dependent variable (Y). In detail can be explained as follows:
4.6.1. Non Physical Work Environment (X1)
Non-physical work environment significantly influences employee performance. Table Coefficient in the sig column shows that the influence of the non-physical work environment (X1) on employee performance (Y) is significant, because Sig. 0,000 <0,05. The result of tcount shows that tcount 4,781> t table 2,016. This means that partially (individually) non-physical work environment variables (X1) on Employee Performance (Y) have a significant effect.
T table results of 2.016 can be seen from the t distribution table of the two-way student test, in columns 0.05 or 5% and row 43 (the number of samples minus the number of independent variables). The value of tcount for the Non Physical Work Environment variable (X1) at the output Coefficient is 4,781. Based on the table above, it is obtained tcount of 4.781 and t table (df = 43) of 2.016 for α of 0.025 (0.05 / 2). Because tcount is greater than ttable (4.781> 2.016), it can be concluded that the variable Non-Physical Work Environment (X1) has a significant effect on the Employee Performance variable (Y). Based on this evidence, it can be concluded that the hypothesis H0 is rejected and Ha is accepted.
4.6.2. Job Characteristics (X2)
Job characteristics significantly influence employee performance. Table Coefficient in the sig column shows that the effect of job characteristics (X2) on employee performance (Y) is significant, because Sig. 0,000 <0,05. The result of tcount shows that tcount 2,543> t table 2,007. This means that partially (individually) the Job Characteristics variable (X2) on Employee Performance (Y) has a significant effect. The ttable results of 2,007 can be seen from the t distribution table of the two-way student test, in columns 0.05 or 5% and at row 51 (the number of samples minus the number of independent variables).
The value of tcount for the Job Characteristics variable (X2) in the output Coefficient is 2.543. Based on the table above, it is obtained that tcount is 2.543 and t table (df = 51) of 2.007 for α of 0.025 (0.05 / 2). Because tcount is greater than ttable (2,543> 2,007), it can be concluded that the Job Characteristics variable (X2) has a significant effect on the employee Kiner variable (Y). Based on this proof, it can be concluded that the Hypothesis Ho is rejected and Ha is accepted.
4.7. Testing the Hypothesis F (F Test)
Testing this hypothesis is to determine the effect of all independent variables (free) with the dependent variable (bound). In the hypothesis of this study, it is assumed that all variables of the Non Physical Work Environment (X1), and Job Characteristics variables (X2) simultaneously affect Employee Performance. The results of testing the F hypothesis can be seen in the following table:
| Model | Sum of Squares |
Df |
Mean Square |
F |
Sig. |
|
1 |
Regression | 80.640 |
2 |
40.320 |
1.716 |
.000a |
| Residual | 2420.087 |
103 |
23.496 |
|||
| Total | 2500.726 |
105 |
||||
| Note: a. Predictors: (Constant), Job Characteristic, non-physical working environment. b. Dependent Variable: Employee Performance. Source: Primary Data are processed using SPSS 19. |
Based on the results of calculations that can be seen in table 4.23, the Sig. 0,000> 0.05, means that the variables of the Non-Physical Work Environment and the Characteristics of the Work together have a significant effect on Employee Performance.
The second way is to compare between Fcount of 1.716> Ftable 3.16, which means that the variable Non-Physical Work Environment and Job Characteristics together have a significant effect on Employee Performance. The results of Ftable can be seen in the distribution table F, in column 2 (The total of all variables is reduced by the number of dependent variables) in line 58 (Total sample minus the number of dependent variables). The conclusion is that the Non Physical Work Environment and Job Characteristics jointly have a significant effect on Employee Performance. Based on this evidence, it can be concluded that the hypothesis H0 is rejected and Ha is accepted.
4.8. Coefficient of Determination (R2)
The multiple determination coefficient (R2) is the square of the correlation coefficient. The Determination Coefficient shows the proportion of the variation of the dependent variable that can be explained by the independent variable. To find out the proportion of employee performance variations that can be explained by the Non Physical Work Environment variable (X1) and Job Characteristics (X2), the SPSS Output model is presented as follows:
Model |
R |
R Square |
Adjusted R Square |
Std. Error of the Estimate |
1 |
0.780a |
0.608 |
0.602 |
4.84727 |
| Note: a. Predictors: (Constant), Job Characteristic, non physical environment. b. Dependent Variable: Employee Performance. Source: Primary Data are processed using SPSS 19. |
The Summary Model shows the Adjust R Square Determination Coefficient of 0.608 or 60.8%. This means that variations in the Non Physical Work Environment and Job Characteristics contribute to variations in Employee Performance of 60.8%, while the remaining 39.2% is influenced by other factors.
5. Conclusion and Suggestions
Based on the results of the analysis with the help of SPSS, it can be concluded that:
There is a positive and significant influence between the non-physical work environment (X1) on employee performance (Y).
This is indicated by the results of the tcount of 4.781 with a significance of 0,000. There is a positive and significant influence between job characteristics (X2) on employee performance (Y). This is indicated by the results of the tcount of 2.534 with a significance of 0,000 and there is a significant influence between the non-physical work environment (X1) and job characteristics (X2) can explain the factors that affect employee performance (Y) of 60.8% and the remaining 39.2% is influenced by variables outside the research.
Some suggestions for improving the performance of employees of PT. Daliatex Kusuma in Bandung are proposed as follows: (1) The HR manager ensures that the division of tasks to employees must be in accordance with the jobs desk or the ability of employees so that none of the employees can use each other and (2) Future research should expand the variables and measurement of research variables so that the performance of employees at PT. Daliatex Kusuma in Bandung is even better.
References
Ghozali, I. (2011). Application of multivariate analysis with the SPSS program. Semarang: Diponegoro University Publishing Agency.
Gunastri, N. M. (2009). Individual characteristics, job characteristics, organizational characteristics, work motivation and employee performance. Scientific Journal: Management Forum, 7(1).
Ida, A. B., & Agus, S. (2008). The effect of work motivation, leadership, and organizational culture on employee job satisfaction and its impact on corporate performance (Case study at PT. Pei Hei International Wiratama Indonesia. Journal of Management and Entrepreneurship, 10, 124-135.
Malthis, R. L., & Jackson, J. H. (2006). Human resource management (10th ed.). Jakarta: Salemba Empat.
Mangkunegara, A. A. A. P. (2006). Human resource management planning and development. Bandung. Pen: PT Refika Aditam.
Mangkunegaraa, A. P. (2009). Human resource performance evaluation. Contents: Refika Aditama Publisher.
Nitisemito, U. S. (2009). Personnel management: Human resource management. Jakarta: Ghalia Indonesia.
Panudju, A. (2003). The effect of compensation and job characteristics on employee satisfaction in production units of PT. X Palembang. Sriwijaya Management & Business Journal, 1(2), 4-17.
Sedarmayanti. (2011). Human resources and work productivity. Jakarta: Mandar Forward.
Stoner, J. A. F. (2006). Management. Englewood Cliffs, N.J.: Prentice Hall.
Subyantoro, A. (2009). Individual characteristics, job characteristics, organizational characteristics and management job satisfaction mediated by work motivation (Study of KUD administrators in Sleman Regency). Journal of Management and Entrepreneurship, 11(1), 11-19.
Wibowo. (2008). Performance management. Jakarta: PT RajaGrafindo Persada.
Wursanto. (2009). Fundamentals of organizational sciences. Yogyakarta: Andi.