A Study on the Fluctuating Trend of Export (Demand Change) of ‘Garlic of India’ by its Price Transformation in International Markets, Under the Time Period of 1991 to 2011
Reena Patidar1
Towseef Mohi Ud Din2
1,2Research Scholars, Department of school of studies in economics, Vikram University Ujjain, (M.P) India. |
AbstractHuge percentage of population are engaged in cultivation of crops in India, that is the reason our economy is known as the agrarian economy. Looking at the importance of this sector the empirical study has been done on one of the agriculture crop that is ‘garlic’ which is exported by India and is the second largest producer after china it earns very good in international markets. The aim of this paper is to explore the importance of this agriculture crop (garlic) which earns a lot and become one of the main cash crop for poor farmers and also help our country to regulate the maximum share of foreign markets. It is now need of hour that government should take good care of all the cultivators of garlic and provide financial support, subsides, minimum support price by which farmers cultivate this crop more efficiently by which our economy generates well. |
Licensed: |
|
Keywords: |
|
| (* Corresponding Author) |
1. Introduction
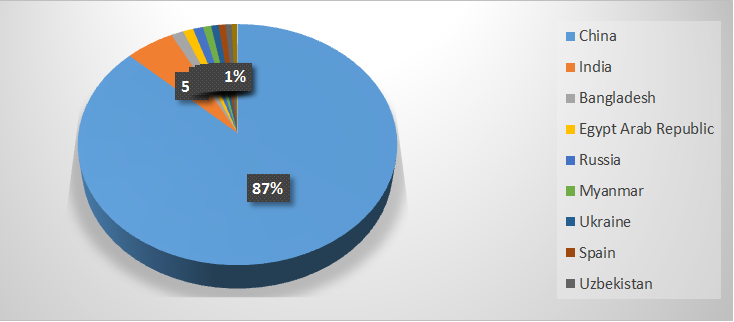
Garlic (scientific name Allium sativum) is one of the important spice consumed by an individual in all over the world, it has its own medicinal value and also used for eating purpose in mixing with our daily food. It has strong-smelling pungent-tasting of its underground part, which is used as a spice for food and in herbal medicine. Garlic has been used by human before several thousand years ago both as a spice and as a traditional medicine. “Garlic has historically been grown for both culinary and medicinal purposes. Bulbs (underground part of plant) are most commonly used, but leaves, scapes, and bulbils are also eaten. Upper part of this plant is used in making of pickle in many states of India. Garlic is frequent in the cuisines of Asia, the Middle East, the Mediterranean, and South and Central America. It has traditionally been used to treat pulmonary problems, coughs, and tuberculosis. Recent works describe numerous traditional medicinal and ritual uses and literary depictions (Block, 2010; Hahn & Strube, 1996)”. “Garlic (Allium sativum) has been used as a spice and a native medicine for many years. It has possessed antibacterial, antifungal, ant parasitic, antiviral, antioxidant, anti-cholesteremi, anti-cancerous, and vasodilator characteristics (Hahn & Strube, 1996)”. According to the Unani and Ayurvedic systems as practiced in India, garlic is carminative and is a gastric stimulant and thus help in digestion and absorption of food. Allicin present in aqueous extract of garlic reduces cholesterol concentration in human blood. Garlic extract has antimicrobial activity against many genera of bacteria, fungi and viruses. Garlic contains a higher concentration of sulphur compounds which are responsible for its medicinal effects. Garlic in India is sown in the month of November December and harvested in the month of May June. One corm garlic contains of 6 to 10 pieces. And it is one of the main agriculture crop which has been exported by India to other countries. Indian is the second largest producer of garlic after in the china which occupy 5.17% of share, here are some leading countries who produce garlic in the world.
Serial No. |
Country | Production |
Share (%) |
1 |
China | 2,00,58,388.00 |
82.86 |
2 |
India | 12,52,000.00 |
5.17 |
3 |
Bangladesh | 3,12,000.00 |
1.29 |
4 |
Egypt Arab Republic | 2,63,167.00 |
1.09 |
5 |
Russia | 2,56,406.00 |
1.06 |
6 |
Myanmar | 2,08,900.00 |
0.86 |
7 |
Ukraine | 1,91,140.00 |
0.79 |
8 |
Spain | 1,77,420.00 |
0.73 |
9 |
Uzbekistan | 1,54,130.00 |
0.64 |
10 |
Argentina | 1,48,953.00 |
0.62 |
| Source: Food & Agricultural Organisation (FAO). |
2. Literature Review
Garlic is one of the main Allium vegetable crops known worldwide. The genus Allium, which belongs to the family Alliaceae, is diverse and comprises about 750 species, but only seven of them are widely cultivated in different parts of the world. Garlic crop is important in many diets, because of their nutritional significances and major economic and dietary importance to small-scale farmers, in addition to fresh consumption, the production of dried and processed garlic products for use in food preparation and as dietary health-food supplements is an important industry (Diriba-Shiferaw, 2016). The economic importance of the garlic crop has increased considerably in the entire world in recent years. Therefore, increasing garlic yield and improving bulb quality are essential aim for both growers and consumers (Shafeek, Aisha, Asmaa, Magda, & Fatma, 2015). India is the largest producer, consumer, and exporter of spices in the world. The demand scenario for major spices in India has been comprehensively examined that it would be increase further in the coming years (Shinoj & Mathur, 2006). India ranks second to china in area and production in both onion and garlic, but ranks 102nd for onion and 74th for garlic in terms of productivity. These crops are generally grown throughout the country especially in the states of Maharashtra, Jammu and Kashmir, Bihar, Andhra Pradesh and Karnataka. The onion and garlic crop is attacked by many diseases and insect pests at different crop growth stages which causes considerable losses in yield. Apart from reduction in crop yield, the disease and insect pests also poses harmful effects during harvesting, post harvesting, processing and marketing stages, which lower the quality and export potential of the crops that significantly causes the economics loss. The diseases and insect pests alter the cropping pattern and also affect the local and export markets (Mishra, Jaiswal, Kumar, Saabale, & Singh, 2014). India has been exporting for many years to the major importing countries like Qatar, Saudi Arabia, Zambia, UAF, Bahrain, Mauritius, Kuwait, Bangladesh and Sri Lanka. The export has been ranging between 2-3 per cent of the total domestic production. The quantum of export of garlic has been fluctuating due to sudden change in the policy of garlic importing countries. China, France, Spain and Egypt are the major exporting countries. The country being at higher latitudes produce bigger cloves garlic is though not on big scale, it is picking up in northern hills and Nilgiris and Kodaikonal hills in view of increased demand in the export market. It is hoped that in the near feature increase in area under those varieties having bigger cloves and have demand in the international market will be produced to the extent by 10-15 times easily (Sekhar, Prahadeeswaran, & Nagaraj, 2014). As a leading producer of garlic, China was the dominant source of imported garlic in the United States, despite the imposition of a hefty duty tax against fresh Chinese garlic imports imposed in 1994. Prior to imposition of the anti-dumping duties China was a major exporter of garlic to the United States (Boriss, 2006). So far Farm-level demand is likely to be much more elastic than consumer-level demand, meaning that farm prices change by a smaller percentage than changes in domestic production. The reason is that, because garlic can be readily bought and sold in international markets, the amount imported and/or the amount exported changes when domestic output varies. This smooths out total supply and moderates price variation (U.S. Dept. of Agriculture).
3. Materials and Methods
Purposively analysis and different supporting tools for this study has been taken for getting better results of garlic export (demand) in India.
Data Source: Wide-ranging facts and figures have been manipulated from the period of 1991 to 2011 (spice board of India). And the study contains the secondary source of data which is collected from different books, journals, research papers, internet etc.
Sample: The systematic study has been done between 1991 to 2011 for export or demand of garlic in India.
Variables: Two variables have been examining like export or demand and the price of garlic in international markets.
Statistical Analysis: Elasticity of demand has been used to show the relation between the price and export or international demand of Indian garlic.
3.1. Objectives
- To understand the current scenario of garlic export in India
- To know the effect of price on demand of garlic in international markets
4. Results and Discussion
Garlic cultivation in India is under horticulture, which is an important sector of Indian agriculture. Horticulture occupies 8.50 per cent area of the cultivable land and contributes about 28.00 per cent of gross agricultural output during 2010-11. India is the traditional exporter of garlic to Qatar, Saudi Arabia, Zambia, UAE, Bahrain, Mauritius and Kuwait. Over the last five years (2000-2005), India has exported only 1.5 per cent to 2 per cent of the domestic production annually. During 201011, India exported 17,300 MT of garlic in the form of fresh or chilled bulb valued totally at ` 6,977.30 lakh. The volume of export has increased as compared to last year 2009-10 (10,750 MT). Low domestic price prevailed during the period has helped India to export more volume of garlic. The major country to India exporting garlic are Bangladesh, Philippines, Singapore, Japan, South Africa, UK, USA, Nepal, UAE and Malaysia. Import of garlic to in the country was very little up to the year 1997-98. During 1998-99, India has imported 5189 tonnes of fresh garlic and 430 tonnes of dried garlic. In 1999-2000 imports stepped up to 11636 tonnes of fresh garlic and 8181 tonnes of dried garlic, apart from import of other garlic products. During 2010-11, India has imported garlic about 310 tonnes with a value of ` 220.05 lakhs (Shivayogi, 2013).
| Group | Year |
Price (000’ $) |
Export or Demand (000' tons) |
| First | 1991- 1992 |
P0 2798 |
X0 370.7 |
1995- 1996 |
P1 1032 |
X1 475.3 |
|
| Second | 1995- 1996 |
P0 1032 |
X0 475.3 |
2001- 2002 |
P1 356 |
X1 496.8 |
|
| Third | 2001- 2002 |
P0 356 |
X0 496.8 |
2005- 2006 |
P1 8487 |
X1 646.6 |
|
| fourth | 2005- 2006 |
P0 8487 |
X0 646.6 |
2010- 2011 |
P1 19214 |
X1 834.97 |
| Source: spieces board of india, 2012. |
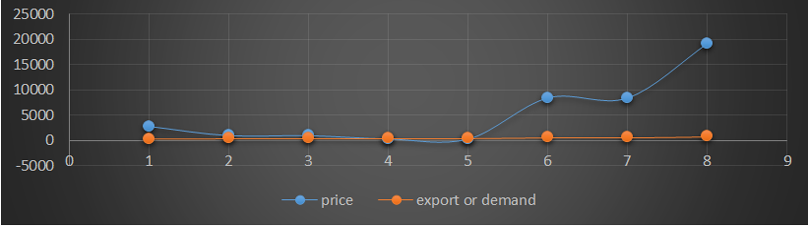
In the above Table 1.2 data has been taken from year 1991 to 2011 in which we can see that price can not effect so much on the export or demand of garlic in international markets. And also it clearly depects in the Figer 1.2 that not much change in demand of garlic has been seen due to price change during last 20 year.
| Group | Year |
Price (000’ $) |
Demand or Export (000' tons) |
| First | 1991- 1992 |
P0 2798 |
X0 370.7 |
1995- 1996 |
P1 1032 |
X1 475.3 |
| Source: spieces board of india, 2012. |

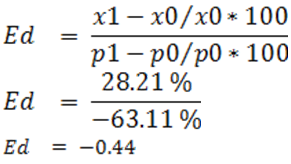
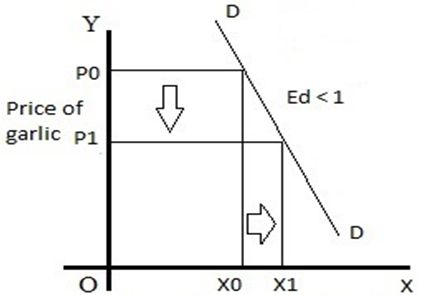
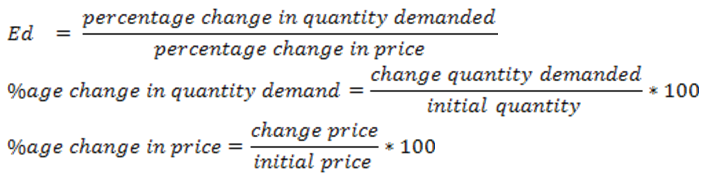
As per the elasticity of demand is concern, when there are percentages change in quantity demanded is less than percentage change in price, then demand for such a commodity (garlic) said to be less elastic or inelastic. In such a case Ed<1, which means the demand curve is steeper and its slope upwards to Y axis as shown in Figure 1.3 which also explains that quantity demanded of garlic rises from x0 to x1 because due to fall in prices from p0 to p1. Apart from this the above Table 1.3 shows that the quantity demanded rises just 28.21% due to 63.11% fall in the price of garlic, so the elasticity of demand is less than one that is (-0.44).
| Group | Year |
Price (000’ $) |
Demand or Export (000' tons) |
| Second | 1995- 1996 |
P0 1032 |
X0 475.3 |
2001- 2002 |
P1 356 |
X1 496.8 |
| Source: spieces board of india, 2012. |
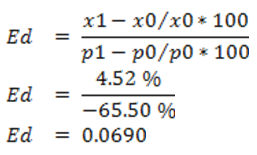
It is the universal truth in the sciences of economics that, when percentages change in quantity demanded is less than the percentage change in price, that time demand for such a commodity (garlic) said to be less elastic or inelastic. In such a case Ed<1, which means the demand curve is steeper towards Y axis as shown in Figure 1.4, which also explains that quantity demanded of garlic are not changed as same proportion as price changes. Demand rises from x0 to x1 because due to fall in prices from p0 to p1. Apart from this the above group second and Table 1.4 shows that the quantity demanded rises just 4.52% due to 65.50% fall in the price of garlic, so the elasticity of demand is less than one that is (0.090).
| Group | Year |
Price (000’ $) |
Demand or Export (000' tons) |
| Third | 2001- 2002 |
P0 356 |
X0 496.8 |
2005- 2006 |
P1 8487 |
X1 646.6 |
| Source: spieces board of india, 2012. |
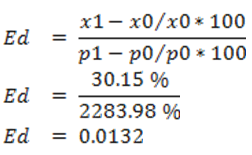
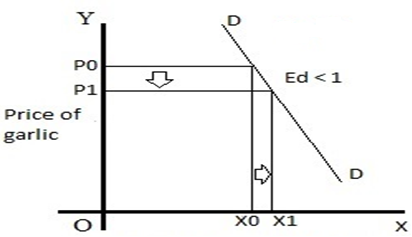
When percentages change in quantity demanded is less than percentage change in price, then demand for such a commodity (garlic) said to be less elastic or inelastic. In such a case Ed<1, which means the demand curve is much steeper to Y axis as shown in Figure 1.5 which also explains that quantity demanded of garlic rises from x0 to x1 because of fall in prices from p0 to p1. And also in the above Table 1.5 which shows that the quantity demanded rises just 30.15% due to 2283.98% fall in the price of garlic, so the elasticity of demand is less than one which is derived in third group above (0.0132).
| Group | Year |
Price (000’ $) |
Demand or Export (000' tons) |
| Forth | 2005- 2006 |
P0 8487 |
X0 646.6 |
2010-2011 |
P1 19214 |
X1 834.97 |
| Source: spieces board of india, 2012. |
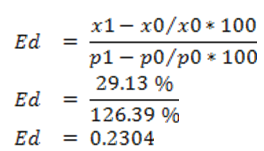
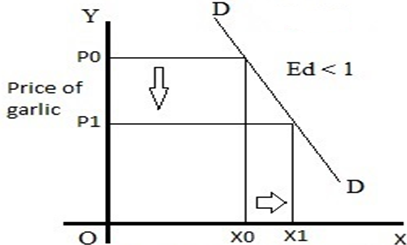
In the above equation it has been clearly shown that if percentages change in quantity demanded is less than percentage change in price, then demand for such a commodity (garlic) said to be less elastic or inelastic. In such a case Ed<1, which means the demand curve is very much steeper to Y axis as shown in Figure 1.6, which also explains that quantity demanded of garlic rises from x0 to x1 because due to fall in prices from p0 to p1. As per above Table 1.6 is concern which shows that the quantity demanded rises from 29.13% due to 126.39% fall in the price of garlic, so the elasticity of demand is less than one and the value of elasticity of demand for forth group is (0.2304).
5. Conclusion
Agriculture plays a vital role in providing the livelihood to about two-thirds of the country’s population. This sector provides employment to 52.00 per cent of the country’s work force and is the main single largest private sector employment generator of India. Large variety of crops are produced and exported from India, garlic is one of the main exported cash crop which generate our revenue and it covers 5.17% of international market. In the above discussion it clearly depicts that the elasticity of demand of garlic in international market is always less than one, which means that garlic become necessity good to somehow. The findings of this study will recommends the policy makers to form sound policies and programmes with relation to expand the production and export of garlic.
References
Block, E. (2010). Garlic other alliums: RSC Publishing Cambridge.
Boriss, H. (2006). Commodity profile: Garlic. Agriculture Marketing Resource Centre.
Diriba-Shiferaw, G. (2016). Garlic nutrient management in Ethiopia - a review. Journal of Spices and Aromatic Crops, 25(2), 91–103.
Hahn, U., & Strube, M. (1996). Functional centering. Paper presented at the Proceedings of the 34th annual meeting on association for computational linguistics.
Mishra, R., Jaiswal, R., Kumar, D., Saabale, P., & Singh, A. (2014). Management of major diseases and insect pests of onion and garlic: A comprehensive review. Journal of Plant Breeding and Crop Science, 6(11), 160-170.
Sekhar, C., Prahadeeswaran, M., & Nagaraj, R. (2014). Garlic trading - a potential agribusiness venture in India. Journal of Horticulture, 1(3), 01- 11.
Shafeek, M. R., Aisha, H. A., Asmaa, R. M., Magda, M. H., & Fatma, A. R. (2015). Improving growth and productivity of garlic plants (Allium sativum L.) as affected by the addition of organic manure and humic acid levels in sandy soil conditions. International Journal of Current Microbiology Applied Sciences, 4(9), 644-656.
Shinoj, P., & Mathur, V. (2006). Analysis of demand for major spices in India. Agricultural Economics Research Review, 19(347-2016-16772), 367-376.
Shivayogi, N. D. (2013). Economics of production and marketing of garlic in North Karnataka. Thesis Submitted to the University of Agricultural Sciences Dharwad.