Impact of Working Capital Management on Financial Performance: The case of Vietnam
Hoang-Lan Le1
Kieu-Trang Vu2
Thi-Bich-Ngoc Le3
Ngoc-Khanh Du4
Manh Dung Tran5
1,2,3,4Advanced Finance 57, National Economics University, Hanoi, Vietnam. |
AbstractThe research investigates the impact of working capital management on financial performance by using the data collected from listed firms on Ho Chi Minh Stock Exchange (HOSE). The sample is comprised of 69 public firms over the period of 3 years from 2014 to 2016. Using the variable Cash Conversion Cycle (CCC) as measurement for Working Capital Management, the research also takes the following variables in to consideration: “Growth, Cash flow, Liquidity, Risk, and Leverage” which are proven to have impacts on firm performance besides working capital management. Regarding the measurements of financial performance, the variables comprise of Return on Assets (ROA), Return on Equity (ROE), and Return on Sales (ROS). The results imply that Working Capital Management positively impacts the financial performance of firms in the sample. Thus, our study gives a new insight to managers on how to improve the financial performance with working capital management. |
Licensed: |
|
Keywords: |
|
| (* Corresponding Author) |
1. Introduction
Financial management plays an important role in management activities of corporations. Financial management activities help to ensure capital for enterprises, to take measures so as to elevate operation efficiency and to control the business operation of firms. The contents of financial management include long-term investment decisions, financing decisions, short-term financial decisions (or working capital management), and many other decisions such as repurchase and mergence, repurchase of company’s shares. Working capital measures a company’s efficiency and represents the liquid assets that are available with a firm. It also indicates firm’s short term financial health and its capacity to meet day-to-day operating expense. Thus, working capital management has a significant impact on firm performance. However, in practice, for Vietnamese enterprises, how to manage working capital efficiently is still a problem. Therefore, it is important to quantify the relationship between working capital management and firm performance. From that point, the managers will have concrete and accurate foundations to manage working capital of their firms.
The purpose of this study is to analyze the impact of working capital management on the financial performance of firms on Ho Chi Minh Stock Exchange (HOSE) in the period of 2014 to 2016. This research contributes another study on working capital management in the world, especially in a developing country. It also helps managers make suitable decision on working capital management in order to elevate their firm performance.
2. Literature Review
It is proven by many empirical studies that the performance of firms can be influenced by many factors, one of which is working capital management. Working capital is viewed as a measurement of both firms’ liquidity and efficiency.
In the world, many empirical researches have been conducted in order to examine the impact of working capital management on firm’s financial performance. Most of the studies concluded that working capital management significantly influences firm’s profitability. However, the specific relationship between the two factors varied according to countries and markets.
The impact of working capital management on firm performance was positive in a number of studies. One of them is Asaduzzaman and Chowdhury (2014) in Bangladesh, an empirical study which was built upon the data from Bangladeshi Textiles firms. The authors found a significant relationship between working capital management and profitability, using four measures, Days of Inventory Outstanding (DIO), Days of Sales Outstanding (DSO), Cash Conversion Cycle (CCC), and Days of Payables Outstanding (DPO) to represent working capital management. While DPO showed a negative impact on profitability, the rest indicated a positive correlation with firms’ profitability. Another empirical research from Nigeria, Imeokparia (2015) has also found a positive relation between working capital management and firms’ performance. In addition, Akoto, Awunyo-Vitor, and Angmor (2013) had examined the impact by using the data from Ghanaian companies, and the results suggested that working capital management (as measured by CCC) positively influenced firms’ profitability as measured by net operating profits.
On the other hand, many researches support the traditional belief of a negative relationship between working capital management and firms’ performance; that is increasing working capital investment by raising proportion of current assets in total assets would negatively affect the profitability of firms. Using the same four measures of working capital management as the Asaduzzaman and Chowdhury (2014), Javid and Zita (2014) found a negative relationship between working capital management and profitability. Similarly, Padachi (2006) studying small-scale manufacturing enterprises in Mauritius for the period 1998-2003, showed that CCC is negatively related to firm performance (as represented by ROA), and that high level of investment in inventories and account receivables is associated with low profitability. Raheman and Nasr (2007) in Pakistan, García-Teruel and Martínez-Solano (2007) in Spain and Kaddumi and Ramadan (2012) in Jordan all came to the conclusion that managers can create more value by shortening CCC.
Moreover, studies on the relationship between working capital management and business performance in Southeast Asia have been conducted. Zariyawati, Taufiq, Annuar, and Sazali (2010) revealed that reducing cash conversion period results in an increase in profitability. Studying companies listed on the Thai stock market, Napompech (2012) came to a similar conclusion; profitability can be increased by reducing CCC. On the other hand, Charitou, Lois, and Santoso (2012) in the study of developing countries in Asia showed a positive relationship between working capital management (CCC) and corporate profitability (ROA). In Vietnam, few studies on the impact of working capital management on firm performance can be found. First of all, Huynh (2010) reported that profitability of a firm is strongly negatively affected by its working capital management. Bui (2017) reported similar findings for 14 listed pharmacy firms and 50 unlisted ones. In contrast, Nguyen, Tran, and Nguyen (2016) found no correlation between the two factors.Not many studies on the topic have been conducted in the emerging market Vietnam, and most of which only explore the results for one specific industry such as Pharmacy in Bui (2017) or the result for listed firms in general. Therefore, this study is devoted to finding and comparing the impacts of working capital management on firm performance in 5 different industries, as well as making some recommendations. Moreover, to provide a different and broader approach we are going to add ROS besides ROA and ROE, which are usually used in prior studies, as measurements of firms’ performance.
3. Data and Methodology
The sample of this study comprised of 69 firms listed on HOSE from 2014 to 2016. The chosen firms belong to five industries: Agriculture, fishery and forestry production, Construction, Food – Beverage – Tobacco, Transportation and Warehousing, and Wholesale and Retail. Industry classifications were based on the classifications on the website of vietstock.vn which used North American Industry Classification System (NAICS). The five industries selected are one of the leading industries in Vietnam, representing the three economic sectors: agriculture sector, industry sector, and service sector.| Industry | No. of firms |
Percentage (%) |
| Agriculture, fishery and forestry production | 11 |
15.94 |
| Construction | 12 |
17.39 |
| Food – Beverage – Tobacco | 12 |
17.39 |
| Transportation and Warehousing | 19 |
27.54 |
| Wholesales and Retails | 15 |
21.74 |
| Total | 69 |
100 |
The data for this study were secondary data which was acquired from Vietstock.vn and the financial statements of the corresponding firms. Financial ratios including ROA, ROE, Net revenues growth rate, Cash Ratio, Liabilities to Assets, DSO, DIO, and DPO were directly obtained from Vietstock.vn. Other figures such as Depreciation, Net revenues, Profit after tax, Total assets were taken from firms’ financial statements. All 69 firms in the sample were required to have available financial statements from 2011 to 2016. In total, 207 firm-year observations were obtained for analysis.
The following regression models were used to investigate the relationship between firm performance and working capital management as:
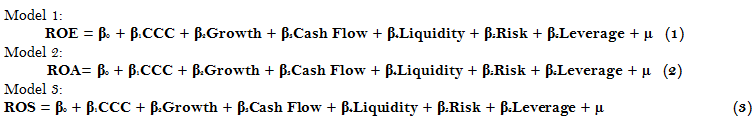
| Variables | Measurement |
| Return on Assets (ROA) | Net Income/Total Assets |
| Return on Equity (ROE) | Net Income/Owners’ Equity |
| Return on Sales (ROS) | Net Income/Net Revenues |
| Cash Conversion Cycle (CCC) | DIO + DSO - DPO |
| Growth | (Net Revenuest – Net Revenuest-1)/Net Revenuest-1 |
| Cash Flow (CF) | (Profit after tax + Depreciation)/Total Assets |
| Liquidity | Cash and cash equivalents/Current Liabilities |
| Risk | Standard deviation of the ratio EBITDA/Total Assets |
| Leverage | Total Liabilities/Total Assets |
CCC is expected to have a negative relationship with firm performance. CCC, which is a measure of working capital management, indicates the efficiency of CCC of a company. Therefore, the shorter the CCC is, the more efficient the company’s operations become, which leads to a better performance of that company. Shorter CCC means a firm has less investment in working capital and thus the costs of financing are lower for this firm. Numerous studies also found a negative impact of CCC on firm performance, including studies of Shin and Soenen (1998), Lazaridis and Tryfonidis (2006), Mohamad and Saad (2010), Huynh and Su (2010), and Napompech (2012).
Descriptive Statistics and Correlation Analysis was used to describe basic quantitative characteristics of the data in this study. It includes the following steps:
First, we calculate mean, median, maximum, minimum, standard deviation values to obtain basic conclusions and evaluation about the sample.Second, we calculate the correlation between variables to ensure the significance of the regression analysis and to find the relationship between independent and dependent variables.
The study also used the multiple regression analysis on the panel data to measure the linear relationship between the variables in the four regression models and to test the hypothesis.
The regression analysis process for each model includes the following steps:
Step 1: Estimate the coefficients of six independent variables in each regression model with the corresponding dependent variable using the Fixed Effect and Random Effect methods in STATA12.
Step 2: Check for possible problems of the regression models include multicollinearity, heteroscedasticity, errors in functional form and omitted variables, serial correlation and normality distribution of error term.
Step 3: Suggest solutions for problems of regression models.
4. Empirical Results
4.1. Descriptive Statistics
Table 3 illustrates the summary statistic of the variables in the model of the impact of WCM to firm performance of 69 firms listed on HOSE from 2014 to 2016. The data was collected yearly, therefore the total observations were 207.
- ROA: the dependent variable which presents the firm performances of listed firms in the sample has the mean of 0.069 (6.9%), the magnitude of fluctuation was relatively large with the lowest ROA -0.944 (-94.4%) belongs to HUD3 Investment and Construction Joint Stock Company in 2014, compared to the highest ROA of 0.722 (72.2%) in 2015 achieved by KIDO Group. The standard deviation of ROA is 0.157.
- ROE: the dependent variable which measures corporations’ profitability has the mean of 0.153 (15.3%), with the lowest of -1.091(-109.1%) and the highest of 0.912 (91.2%); these were the ROAs of Japan Vietnam Medical Instrument Joint Stock Company in 2015 and KIDO Group in 2015 respectively. Its standard deviation is 0.203.
- ROS: the ROS of firms in the sample which presents companies’ operational efficiency has the lowest and highest values of -2.632925 and 1.67826 respectively. The average value of ROS is 0.1229, which indicates that in general, firms in the sample use about 87.71% of their revenue to run businesses. Its standard deviation is 0.2905.
- CCC: the CCC of firms in the sample ranges from -55.66 days to 2732.4 days, which indicates that these firms had a large Cash Conversion Cycle variance. The average CCC is more than 148 days (approximately 5 months) with a standard deviation of 274 days.
- Growth: the independent variable representing sales growth has the highest value of 4.167 (416.7%) while lowest value of -0.999 (-99.9%), which means firms in the sample have relatively high growth. The variable has the mean of 0.189 (18.9%) and standard deviation of 0.520.
- Cash Flow: the mean cash flow variable is 0.27 and the maximum and minimum values are 9.61 and -1.5, respectively. The standard deviation is 1.060.
- Liquidity: cash ratio has an average value of 0.774, which indicates that most listed firms in the sample don’t have good liquidity abilities. The maximum value of the variable is 8.29 while the minimum value is only 0 and the standard deviation is 1.393.
- Risk: the average value of risk variable is 1.470, which indicates that most of the listed firms in the sample have high risk. The highest and lowest values are 0 and 64.99, respectively. The standard deviation is relatively high (about 6.589).
- Leverage: the financial leverage variable ranges from 0 to 0.948. The mean is 0.314, which shows debt in average accounts for 31.4% in these listed firms. The standard deviation is quite small (0.251).
| Variables | Minimum |
Maximum |
Mean |
Std. Deviation |
n |
| ROE | -1.091 |
0.912 |
0.153 |
0.203 |
207 |
| ROA | -0.944 |
0.722 |
0.069 |
0.157 |
207 |
| ROS | -2.632925 |
1.67826 |
0.1228809 |
.2904876 |
207 |
| CCC | -55.66 |
2732.4 |
148.533 |
274.187 |
207 |
| Growth | -0.999 |
4.167 |
0.189 |
0.520 |
207 |
| Cash Flow | 9.61 |
-1.5 |
0.237 |
1.060 |
207 |
| Liquidity | 0 |
8.29 |
0.774 |
1.393 |
207 |
| Risk | 0 |
64.99 |
1.470 |
6.589 |
207 |
| Leverage | 0 |
0.948 |
0.314 |
0.251 |
207 |
4.2. Correlation Analysis
ROE |
ROA |
ROS |
Growth |
Cash flow |
Liquidity |
Risk |
Leverage |
CCC |
|
| ROE | 1.0000 |
||||||||
| ROA | 0.6300 |
1.0000 |
|||||||
| ROS | 0.5944 |
0.5387 |
1.0000 |
||||||
| Growth | 0.1630 |
0.0693 |
-0.0049 |
1.0000 |
|||||
| Cash flow | 0.0625 |
0.0863 |
0.1813 |
-0.1292 |
1.0000 |
||||
| Liquidity | 0.0564 |
0.0763 |
0.1870 |
-0.0404 |
-0.0183 |
1.0000 |
|||
| Risk | -0.2961 |
-0.2639 |
-0.4965 |
-0.0741 |
-0.1007 |
-0.0112 |
1.0000 |
||
| Leverage | -0.2645 |
-0.2662 |
-0.2861 |
-0.0302 |
-0.0813 |
-0.3859 |
-0.1317 |
1.0000 |
|
| CCC | -0.3478 |
-0.2384 |
-0.1814 |
-0.1682 |
-0.0964 |
-0.1318 |
0.0723 |
0.4183 |
1.0000 |
Table 4 shows that ROE, ROA and ROS negatively correlate with variables which are CCC, leverage and risk. In addition, they have positive correlation with variables that are cash flow, and liquidity. Besides, ROE and ROA both positively correlate with growth, whereas the correlation between ROS and growth is negative. In particular, the independent variables including CCC, leverage and risk have the strongest impacts on ROE, ROA and ROS of firms, respectively. In addition, the correlation matrix also indicates that the correlation coefficients between variables are all less than 0.7. Therefore, it is concluded that there is no strong correlation among variables in one model and the multicollinearity problem will not occur.
Model 1 |
Model 2 |
Model 3 |
|
ROE |
ROA |
ROS |
|
| Constant | -0.0046751 |
-0.0029774 |
-0.1626309 |
| CCC | 0.0002715 |
-0.00000417 |
0.0001247 |
| Growth | 0.0587156 |
0.017177 |
0.0252171 |
| Cash Flow | 0.5588837 |
0.384386 |
0.0252171 |
| Liquidity | 0.0025008 |
-0.0133654 |
0.0076139 |
| Risk | -0.0022824 |
-0.0019014 |
-0.0082754 |
| Leverage | -0.080729 |
-0.026648 |
0.0453104 |
| R-squared | 0.5570 |
0.3001 |
0.6583 |
| Prob(F-statistic) | 0.0000 |
0.0000 |
0.0000 |
| Observation | 207 |
207 |
207 |
ROE= -0.0046751 + 0.0002715CCC + 0.0587156Growth + 0.5588837Cash Flow + 0.0025008Liquidity - 0.0022824Risk - 0.080729Leverage
ROA= -0.0029774 - 0.00000417CCC + 0.017177Growth + 0.384386Cash Flow -0.0133654Liquidity -0.0019014Risk -0.026648Leverage
ROS= -0.1626309 + 0.0001247CCC + 0.0252171Growth + 0.0252171Cash Flow + 0.0076139Liquidity - 0.0082754Risk + 0.0453104Leverage
4.3. Regression Analysis
Regression analysis is applied to find the relationship between firm performances and working capital management. We base on the results of the Hausman test to choose between Random Effect Estimation and Fixed Effect Estimation. The results of the test signify that Fixed Effect Estimation is to be applied on model 1, model 2 and model 3. Table 5 shows the results that are obtained by using CCC as the measure of WCM.
The result for the relationship between CCC and ROA in model 2 is not statistically significant, hence are not reported here.
The result model 1 and 3 shows that CCC has positive impact on ROE and ROS. The coefficients of CCC for ROE and ROS are 0.0002715 and 0.0001247 respectively, with the significant level of 10%. This indicates that, if CCC increases by 1 unit, ROE and ROS will increase by 0.0002715 and 0.0001247 on average respectively, under the condition that the other factors are holding the same. The results lead to a conclusion that the longer CCC would somehow lead to higher ROE and ROS for firms.
In addition, based on the results of three models 1, 2 and 3, cash flow has positive impacts on ROE, ROA and ROS. These relationships are statistically significant at 10% level. Besides, the results of model 1 and 3 also show that the relationships between growth and ROE, risk and ROS are statically significant. Growth has a positive impact on ROE while risk negatively affects ROS. The R2s show that overall the models for ROE, ROA and ROS can explain 55.7%, 30.01% and 65.83% of all the variability, respectively. Moreover, the F-statistics indicates that overall the significant levels of 3 models are at 10% level.
5. Discussions
5.1. Working Capital Management
Based on the empirical results, the variable representing working capital management (CCC) had a significant positive relationship with firm performance in Vietnamese listed firms as CCC had statistically significant relationships with two out of three firm performance measurements (ROE and ROS). Although there has been a large number of research that found a significant negative relationship between CCC and firm performance such as Lazaridis and Tryfonidis (2006) our study on HOSE listed firms gave an opposite result. Our result indicates that when CCC is longer, firm performance is better. A longer CCC also means longer DIO, or longer DSO, or shorter DPO, as they are three components of CCC. The causes of this result can be explained by any of the following reasons.
Firms with longer DIO may maintain a large amount of inventory. High levels of inventory and generous trade credit policy for customers may increase sales, as stated by Deloof (2003) which can lead to higher profitability. Larger inventory also reduces the risk of an out-of-stock event. If a stock-out happens, firms may incur high costs due to possible disruptions in the production process, or losses from business operations because of the scarcity of goods, according to Blinder and Maccini (1991). Moreover, maintaining large inventory can decrease supplying costs and protect firms against price fluctuations (especially in an economy with high inflation rates and adverse macroeconomic factors), among other advantages. On the other hand, granting a generous trade credit with longer payment period can simulate sales as it encourages customers to purchase goods when demand is low, allows customers to assess products’ quality and ensure that the delivery of products and services are carried out as contracted (Smith, 1987) and helps build long-term relationships with customers. By contrast, with shorter DPO, firms can gain benefits of a sales discount for early payment. Firms which delay their payments tend to have more problems and have their reputation damaged, and as a result their profits are negatively affected.
The positive relationship between CCC and firm performance is in agreement with (Asaduzzaman & Chowdhury, 2014), Charitou et al. (2012), Akoto et al. (2013).
5.2. Growth
Overall, growth rates had a positive relation with firm performance in Vietnamese listed firms. This result is in agreement with studies of Zeitun and Tian (2007) , García-Teruel and Martínez-Solano (2007) , and Nguyen et al. (2016) . It is obvious that firms with high growth rates can create more profits from investments and have more opportunities to invest in profitable projects, which improve firms’ performance. High growth rates also illustrate an increase in efficiency and a decrease in cost of capital.
5.3. Cash Flow
Cash flow had a significant positive relationship with all firm performance measurements. This is because firms with high cash flow can invest in positive projects without raising external funds at high cost.
5.4. Risk
Risk negatively affected ROS in Vietnamese listed firms. With fluctuations in cash flows, firms have higher probability of facing risk of default, financial distress and greater bankruptcy costs, which reduces corporate performance
References
Akoto, R. K., Awunyo-Vitor, D., & Angmor, P. L. (2013). Working capital management and profitability: Evidence from Ghanaian listed manufacturing firms. Journal of Economics and International Finance, 5(9), 373-379.
Asaduzzaman, M. A., & Chowdhury, T. (2014). Effect of working capital management on firm profitability: Empirical evidence from textiles industry of Bangladesh. Research Journal of Finance and Accounting, 5(8), 175-184.
Blinder, A. S., & Maccini, L. J. (1991). The resurgence of inventory research: What have we learned? Journal of Economic Surveys, 5(4), 291-328.
Bui, H. (2017). Managing working capital in relation to the business performance of pharmaceutical companies listed on the stock market of Vietnam. PhD Thesis. Foreign Trade University.
Charitou, M., Lois, P., & Santoso, H. B. (2012). The relationship between working capital management and firm’s profitability: An empirical investigation for an emerging Asian country. International Business & Economics Research Journal, 11(8), 839-847.
Deloof, M. (2003). Does working capital management affect profitability of Belgian firms? Journal of Business Finance & Accounting, 30(3), 573-587.
García-Teruel, P. J., & Martínez-Solano, P. (2007). Effects of working capital management on SME profitability. International Journal of Managerial Finance, 3(2), 164-177.
Huynh, P. D. (2010). The relationship between working capital management and profits of companies listed on the stock market of Vietnam. Bank Magazine, 13, 40-44.
Huynh, P. D., & Su, J. T. (2010). The relationship between working capital management and profitability: A Vietnam case. International Research Journal of Finance and Economics, 49(2010), 59-67.
Imeokparia, L. (2015). Working capital management and performance of food and beverage industry in Nigeria. Research Journal of Finance and Accounting, 6(4), 196-205.
Javid, S., & Zita, V. P. (2014). Impact of working capital policy on firm’s profitability: A case of Pakistan cement industry. Research Journal of Finance and Accounting, 5(5), 476-484.
Kaddumi, T. A., & Ramadan, I. Z. (2012). Profitability and working capital management: The Jordanian case. International Journal of Economics and Finance, 4(4), 217-226.
Lazaridis, I., & Tryfonidis, D. (2006). The relationship between working capital management and profitability of listed companies in the Athens stock exchange. Journal of Financial Management and Analysis, 19(1), 26-35.
Mohamad, N. E., & Saad, N. B. (2010). Working capital management: The effect of market valuation and profitability in Malaysia. International Journal of Business and Management, 5(11), 140-145.
Napompech, K. (2012). Effects of working capital management on the profitability of Thai listed firms. International Journal of Trade, Economics and Finance, 3(3), 227-232.
Nguyen, H. C., Tran, M. D., & Nguyen, D. T. (2016). Working capital management and firms’ profitability: Evidence from Vietnam’s stock exchange. International Journal of Economics and Finance, 8(5), 55-62.
Padachi, K. (2006). Trends in working capital management and its impact on firms’ performance: An analysis of Mauritian small manufacturing firms. International Review of Business Research Papers, 2(2), 45-58.
Raheman, A., & Nasr, M. (2007). Working capital management and profitability - case of Pakistani firms. International Review of Business Research Papers, 3(1), 279-300.
Shin, H.-H., & Soenen, L. (1998). Efficiency of working capital management and corporate profitability. Financial Practice and Education, 8(2), 37-45.
Smith, J. K. (1987). Trade credit and informational asymmetry. The Journal of Finance, 42(4), 863-872.
Zariyawati, M. A., Taufiq, H., Annuar, M. N., & Sazali, A. (2010). Determinants of working capital management: Evidence from Malaysia. Paper presented at the In Financial Theory and Engineering (ICFTE), International Conference.
Zeitun, R., & Tian, G. G. (2007). Capital structure and corporate performance: Evidence from Jordan. Australasian Accounting, Business and Finance Journal, 1(4), 40-61.