Demographic Dividend and Social Well-Being in Burkina Faso: Evidences From Household Living Conditions Surveys
Dalomi Bahan1*
Latif Dramani2
1,2Université de Thiès, Senegal. |
AbstractThe aim of this paper was to analyze the impact of demographic dividend on social well-being in Burkina Faso using data of Household Living Conditions Surveys with vector correction model. The findings show that the demographic dividend is the key driver of social well-being at long time. However, harnessing the demographic dividend is accompanied by an increase in consumption of electricity per capita and inflation that reduce the impact of the demographic dividend. These findings suggest the necessity to reinforce the actions in the area of health, education, economic policies, governance and particularly employment to harness the demographic dividend. Government of Burkina Faso could encourage the solar electricity and also develop strategy to reduce the impact of inflation on the life of population. |
Licensed: |
|
Keywords: JEL Classification |
|
Accepted: 16 April 2020 |
|
| (* Corresponding Author) |
Funding: This study received no specific financial support. |
Competing Interests: The authors declare that they have no competing interests. |
Acknowledgement:The authors would like to thank Dr Onadja Yentema who accepted to read the paper and make comments to improve its quality. We are also grateful to an anonymous referee and the editor for helpful comments and suggestions. |
1. Introduction
The concept of the demographic dividend was introduced at the end of 1990s to describe the interaction between the demographic changes and the rapid economic growth in East Asia (Bloom., Sachs, Collier, & Udry, 1998; Bloom.., Canning, & Malaney, 2000). It was formulated with reference of the East-Asian economic miracle, which occurred in the years 1960s to 1990s (Groth, May, & Turbat, 2017). It refers to the acceleration of the economic growth resulting from evolution of the age structure of the population when strategic investments in the areas of health, education, economic policy and good governance have been realized. Capturing the demographic dividend creates a favorable environment not only for wealth creation but also for improving the quality of life of population. Two aspects emerge from the demographic dividend: (i) a quantitative aspect reflected by economic growth; (ii) a qualitative aspect reflecting development.
The starting point of the demographic dividend is the demographic changes leading to the changes in the age structure of the population. Indeed, with fewer births every year, the population of a labor market becomes higher than the dependent population. With more people in the workforce and fewer dependents to take care of, fewer investments are needed to meet the needs of the youngest and oldest groups of the population. This creates an opportunity of the economic growth and faster human development for a country if economic investments are made in the strategic areas such as health, education, governance and economy. It highlights the effect of the population structure changes on the economic growth.
Many studies have showed the importance of the changes in the population age structure in accelerating the economic growth for the emerging countries, particularly in East Asia (Bloom & Williamson, 1998; Bloom.. et al., 2000; Mason, 2005). Therefore, one of the attempt explanations of the gap between the economic growth of sub-Saharan African countries and that estimated for a sample of other countries including Burkina Faso concludes that most of this gap is explained by the demographic factors (Ndulu, Chakraborti, Lijane, Ramachandran, & Wolgin, 2007). Indeed, in sub-Saharan African countries, high dependency ratios are observed due to high fertility levels, whereas they have rapidly declined elsewhere due to rapid fertility declines. Moreover, in sub-Saharan Africa, life expectancy is still low and progress more slowly than elsewhere.
In the current international context of emergence of Africa, the demographic dividend is presented as a key element of Africa's lagging behind the rest of the world. For example, the World Bank, in partnership with the United Nations Population Fund, has developed a regional project called "Sahel Women’s Empowerment and Demographic Dividend" covering seven (7) countries in West and Central Africa. The goal of the project is to accelerate the demographic transition (reduction of fertility rate and infant mortality) to harness the demographic dividend (economic benefits) and to reduce gender inequalities in the Sahel region.
While the quantitative dimension has been the subject of numerous analyses in the worldwide (Bloom & Williamson, 1998; Mason, 2005) and particularly in Africa (Dramani, 2016; Nayihouba, 2015) through the impact of the demographic dividend on the growth economic, studies on the qualitative dimension (link with improvement of population living conditions) are particularly rare in the world and non-existent in Burkina Faso. Bloom and Williamson (1998) used econometric modeling to estimate the contribution of the demographic dividend to about one-third of the economic growth in East and South-East Asian countries, while Mason (2005) used a growth comparison method to estimate this contribution to a quarter of the economic growth.
If the purpose of all interventions is to improve the living conditions of the population, one of the relevant questions is to know to what extent the demographic dividend would improve the population well-being in Burkina Faso. This question remains an important gap in the research area. The analysis of the relationship between the demographic dividend and social well-being is particularly relevant in the context of Burkina Faso where the development policies are focused on the capture of the demographic dividend. Therefore, study the relation between demographic dividend and social well-being will fill the gap in research area and in the programmatic area. It will also encourage technical and financial partners to finance the interventions in order to harness demographic dividend. Moreover, from the structural adjustment programs to accelerated growth and sustainable development strategies, progress has been made in terms of the economic growth in Burkina Faso. Although these economic growth rates varied between 1990 and 2015 (Bahan & Dramani, 2015) they are overall appreciable. Despite the significant economic growth registered, poverty does not seem to have decreased significantly during the period. It rose from 44.5% in 1994 to 48.6% in 2003 and 40.1% in 2015.
The paper is organized as follows. Following the introduction, the second section presents the literature review related to policies to harness the demographic dividend, its returns. The third section presents the methodological approaches. Concerning the fourth section, it presents the main results. The last section is devoted to discussions, conclusions and recommendations.
2. Literature review
2.1. What Policies to Harness the Demographic Dividend
Experience from the Asian Tigers and other regions as South America shows that the comprehensive reforms that countries put in place to harness the demographic dividend can be categorized into the following five pillars or wheels: (i) Demographic Transition; (ii) Education; (iii) Health; (iv) Economic Reforms and Job Creation; and (v) Governance and Accountability. All the five policy pillars or wheels are interrelated and should be implemented concurrently in order to drive the country towards the economic prosperity that can result from the demographic dividend (Bloom.., Canning, & Sevilla, 2003; Canning, Sangeeta, & Abdo, 2016; Guengant, 2011; Mehrotra, 2015).
Education policies will have to be associated with employment policies that create a fit between human capital and growth-oriented demands. Emphasis should be placed on creating new jobs in booming economic sectors and should be available in a synchronized manner with the production of a skilled workforce. In addition, the regulations should create a sufficiently flexible labor market to facilitate the insertion of this labor force into booming sectors of the economy, particularly in manufacturing industries. At the same time, supervision is necessary for occupational safety. Similarly, in order to take advantage of the growing number of women seeking to enter the labor force, employment policies should promote equal opportunities for all types of recruitment (Economic Commission for Africa, 2013; Moreland, 2017).
In the area of health, it is important to emphasize family planning. For African Institute for Development Policy (2012) investments in family planning will stimulate socio-economic development in Africa. Family planning saves lives of women and children. For example, the 2008 estimates show that contraceptive use led to an estimated of 32% reduction in maternal deaths in Sub-Saharan Africa, translating into an estimated 88,227 lives of mothers saved (African Institute for Development Policy, 2012). Moreover, investing in family planning contributes to make savings in maternal and child health care costs. Family planning helps enhance environmental preservation and reduce global warming because the reduction of unplanned pregnancies can decrease fertility, slow population growth, enhance environmental preservation and reduce vulnerability to the climate change effects. For Guengant (2017) the first step to trigger a rapid and sharp fertility decline is to improve and expand the supply of family planning services through programs that offer reliable information and quality services.
Taking advantage of the economic growth from changes in the population age structure requires specific economic policies. These policies aim to promote the supply of a large and highly skilled workforce, which can easily reinforce the economic sectors, particularly in the industrial sector, where there is a high demand for beginning workers and with enormous potentialities. Education expansion policies need to be put in place in conjunction with policies to improve the quality of education and also the availability of secondary and higher education institutions. The skills required in the sectors with high contribution of a country's economy, particularly those that will foster industrialization, need to be identified and these skills should be given special attention in the context of education and employment.
It has been found that the different types of tax policies favor the accumulation of capital to boost growth. In general, the free market economies have a higher rate of return to investment and are thus more inclined to reap dividends because of market flexibility and structural capacity for expansion (Moreland et al., 2014)(Economic Commission for Africa, 2013). For Economic Commission for Africa (2013) some experts point to the lack of openness of Latin American economies as a reason for the small size of their demographic dividend compared to East Asia.
For African countries, Groth et al. (2017) classify polices to capture demographic dividend in two groups: (i) policies to achieve the necessary conditions (family planning coverage; demand creation for smaller family size and; African leadership and donors); (ii) policies to achieve sufficient conditions (employment policies; salary policies; social policies; education and gender policies). The necessary conditions help to open demographic dividend window of opportunity and the sufficient conditions are required to improve the employment dependency ratio (EDR1 ) and the socioeconomic dependency ratio (SDR2 ).
2.2. Returns of the Demographic Dividend
Analyzing the impact of the demographic dividend on three key support systems (education, health care, and pensions), Tim, Ciro, Paulo, and Holz (2008) showed that for Latin American countries, large decline in the dependency rates for primary and secondary education translated into significant freeing of resources. These resources could be used for increasing the coverage and quality of education systems. Moreover, they indicate that providing universal primary and secondary education in societies at the start of the demographic transition would require 4.5 times the level of societal resources used in a low-fertility society. Changes in age structure will lead to a substantial reduction in the fiscal burden associated with financing education and make possible significant expansions in educational coverage.
Tim et al. (2008) show that there is a negative relationship between the demographic dependency and the average investment in children in Latin America and OECD Nations. According to these authors, the decline in the education dependency ratios (both primary and secondary education) can generate substantial reductions in the costs of achieving universal secondary education over time. Therefore, if educational spending is maintained at their current levels relative to GDP, investments in education per child would gradually increase over time. In the same way (Lutz, 2014) the demographic dividend is an education-triggered dividend. In addition, smaller numbers of children can allow a quantity–quality tradeoff, with each child receiving a larger investment in health and education.
In the area of health, the most important impact of the demographic dividend is the composition of health care spending. The health care needs of the older population come to represent a greater share of all health care spending in societies, especially because older persons, on average, use many more health resources than working-age individuals (Tim et al., 2008). In Latin America, NTA estimates indicate that the average older person consume twice as much health care as the average working-age adult. For the region as a whole, health spending for older persons would have amounted to about one tenth of all health spending in 1970 and would be projected to rise to about one quarter by 2030. One of the challenges of health systems will be the need to focus on chronic diseases such as cancer and heart disease as the population ages.
Ageing populations in both emerging and developed nations are driving up the demand for healthcare. According to the United Nations, the world’s population is expected to increase by one billion people by 2025. Of that billion, 300 million will be people aged 65 or older, as life expectancy around the globe continues to rise. Additional healthcare resources and service innovation are needed globally to deliver the long-term care and chronic disease management services required by a rapidly increasing senior population.
One of the conditions to harness the demographic dividend is the demographic transition, which also affects labor supply. More people of working age means that there will be more people looking for work. Providing the labor market can absorb more workers and increase the production per capita. The large number people in working age that remains unemployed can become a potential source of social and political instability (Hayes & Setyonaluri, 2015). Moreover, fewer children allow greater female labor market participation (Bloom, Canning, Fink, & Finlay, 2009).
A rapid fertility decline modifies the population age structure, so that fewer investments are required to meet the needs of young persons. This decline is often accompanied by an extension in the average life expectancy that increases the proportion of the population that is in the working age-group. Consequently, total household income and thereby total household consumption will be directly affected because children contribute to family earnings by working. Per capita household income and consumption are affected because consumption is spread across fewer household members (Mason. & Lee, 2004).
Analyzing the effect of demographic dividend on the proportion of the population living with less than $US 1 per day, Mason. and Lee (2004) show that: (i) the economic growth due to fertility decline is as effective to reduce poverty as the other growth policies; and (ii) the economic growth is equally effective to reduce poverty in all regions. For Mason and Lee (2007) the biggest winners of demographic dividend are the children of couple who decided to have lower fertility and parents are altruistic towards their children. The parents did gain, but by less than their children. Using Error Correction Model, Dramani (2016) shows that demographic dividend is a source of the economic growth in Senegal. An increase in the support ratio of one percentage point translates into an increase in per capita income of 3.7%.
For Economic Commission for Africa (2013) at the microeconomic level, a growth in the working-age population employed implies higher economic returns and higher incomes per household. In addition to the low costs of maintaining dependents, the income of households could increase. Income growth per household affects both spending and savings related to human capital. With fewer children per household and increase in income, each household has the capacity to invest additional resources in education, nutrition and health care for each child. Over time, income growth per household could lead to the growth of savings, especially when heads of households are in the 40 and 65 age groups.
At the macroeconomic level, when growth in the working-age population is sufficiently used as a labor force, this leads to a growth in output per individual for the country. Private savings of household are often invested, contributing to capital accumulation at the national level, which could be used to finance the economic growth. The savings growth creates a favorable financial environment for foreign investment, especially for foreign direct investment (FDI). Thus, the savings growth generates the economic growth and also acts as a stimulus for external financing.
3. Methodological Approaches
3.1. Analytical framework
Social well-being represents not only the satisfaction of needs but also the fulfillment of the person through his physical, mental and intellectual capacities and is understood at the individual and collective level (Maslow, 1943). Using theoretical framework proposed by the Organization for Economic Cooperation and Development (OECD), five (5) dimensions (literacy, health, social ties, work-life balance, and job security) were selected to capture social well-being (Bahan & Dramani, 2020).
To analyze the impact of the demographic dividend on social well-being, we used the theoretical model by Bloom... and Canning (2004) to analyze the economic growth. This model seems adapted to our research problematic. It is a standard conditional convergence equation to deduce the relationship between per capita income growth and demographic variables (Dramani, 2016). In addition, the model is based on the growth models of Barro and Sala-I-Mart (2004).
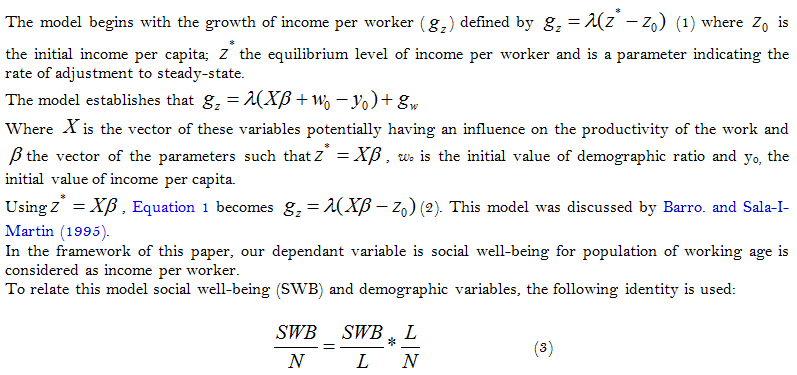
SWB is the level of social well-being; ![]() is the total population and
is the total population and ![]() is the population of working age. Equality simply indicates that the level individual social well-being is equal to social well-being per population of working age, multiplied by the proportion of potential workers in the total population.
is the population of working age. Equality simply indicates that the level individual social well-being is equal to social well-being per population of working age, multiplied by the proportion of potential workers in the total population.
By applying the logarithmic transformation to the Equation 3, we obtain
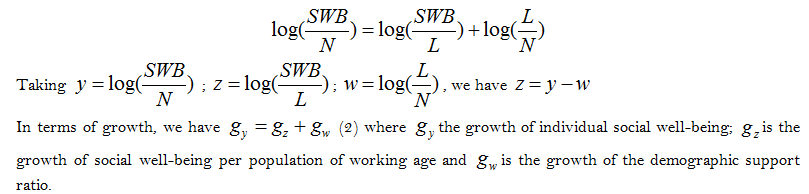
Using these Equations 1 and 2, the basic equation becomes![]() .
.
Our empirical model is based on this last equation, which states that over time, growth of social well-being depends on potential variables explaining social well-being (X) and the growth of demographic support ratio. Dramani (2016) discusses the limits of demographic support ratio considered as an approximation of economic support ratio.
However, it should be noted that all other variables that can influence social well-being per worker must not only be taken into account but also that the vector ![]() may contain time-invariant factors. Since the analysis focus only on Burkina Faso, these factors, initial state
may contain time-invariant factors. Since the analysis focus only on Burkina Faso, these factors, initial state ![]() and
and ![]() are eliminated from the equation (Dramani, 2016).
are eliminated from the equation (Dramani, 2016).
The equation becomes ![]() where
where![]() is a set of variables that can affect the social well-being per worker. Finally, social well-being depends on demographic dividend and potential variables explaining social well-being (X).
is a set of variables that can affect the social well-being per worker. Finally, social well-being depends on demographic dividend and potential variables explaining social well-being (X).
The life cycle assumption postulates that workers have positive savings while younger and older people who consume more are not dependent. Therefore, an increase in the demographic support ratio is likely to be associated with an increase in savings and therefore social well-being.
3.2. Variables of Study
3.2.1. Dependent Variable: Social Well-Being
The social well-being is a composite variable created following the methodology developed by Bahan and Dramani (2020) referring to well-being model of Organization for Economic Cooperation and Development (OECD) in their article entitled Family structures and social well-being in Burkina Faso. According the methodology, well-being has eleven (11) components. In the case of our study, five (5) components have been identified to operationalize social well-being. These components are literacy, health, work and life balance; social links and, security in employment. The choice of these components is justify by the definition of social well-being, the content of our dataset and the potential relationship between the different components.
To operationalize social links, we used two variables: (i) the membership to association and; (ii) the existence of somebody who can assist in case you have serious problem. Work and life balance has been operationalized by time allocated for hobbies, for them and the time allocated to heavy activities. Heavy work is defined as job taking more than 50 hours per week. Therefore work and life balance is satisfied when the time allocated to work is comprised between 20 and 50 hours per week. The value of variable is 1 when the time allocated to work is comprised between 20 and 50 hours and 0 if not.
Regarding the health, the morbidity is the key variable used. It is operationalized by the percentage of people who has not experienced sickness during the two week preceding the survey. The variable takes the value 0 for those who have experienced sickness and 1 otherwise. In the area of education, we have used literacy. We attribute the value 0 when people know reading and writing and 0 otherwise. For security in employment, we attribute 0 for which job is secured and 0 for which job is not secured.
These five variables have been combined using Factorial Analysis of Multiple Correspondences to obtain a composite variable, unique and interpretable. This variable has been normalized between 0 and 1. When the value of the composite variable is near to 1, social well-being is better and it is not when it is near to 0. The robustness has been put in test by Bahan and Dramani (2020).
3.2.2. Main Independent Variable: Economic Support Ratio
In this paper, demographic dividend is measured by economic support ratio instead of demographic support ratio. In his article on the impact of the demographic dividend on economic growth in Senegal, Dramani (2016) highlights the limits of the demographic support ratio used to approximate the relationship between workers and consumers and aligns with the proposition from Cutler, Poterba, Sheiner, Summers, and Akerlof (1990) taking into account the effectively occupied labor force and the number of actual consumers. Among these limitations we have (i) the fact that the entire population of working age is not necessarily employed; (ii) Individuals do not have the same consumption needs and therefore the total population cannot approximate the actual consumers.
The new indicator in place of the demographic support ratio is the economic support ratio defined by
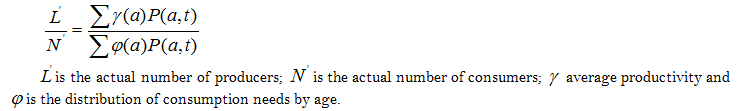
For Dramani (2016) the economic support ratio not only has the advantage of reflecting the age structure of the population but also taking into account the consumption and income-by-age profile.
Following Mason (2005) the United Nations (2017) are currently quantifying the size of the first demographic dividend as economic support ratio rate growth, measuring the direct contribution of changes in the support ratio to economic growth.
3.2.3. Control Variables
Taking the model proposed by Bahan and Dramani (2020) other variables will be included in the model. These variables included (i) access to drinking water rate; (ii) consumption of electricity per capita, (iii) gross domestic per capita; and (iv) inflation rate.
3.3. Data
The data we use to apprehend social well-being come from national surveys of household’s conditions organized in Burkina Faso. A total of six (6) surveys have been organized in 1994, 1998, 2003, 2005, 2007 and 2015. 3demographic characteristics, education, employment, health, durable goods, employment, housing and sanitation. Moreover, we have the informations related family businesses, property and pension income, transfers, food security, shocks and survival strategies, savings and access to credit.
The sample size of survey in terms of number of households varies from 8,478 for survey organized in 1998 to 10,800 organized in 2015. The sample size for 1994 survey is 8,700 households, 8,500 in 2003, 8,439 in 2005 and 8,496 in 2007. These surveys provide information about drinking water rate. Table 1 describes the key variables used to compute social well-being. Analyzing the data of the Table 1, trend of all variables are note linear. So, it is important to smooth the data before modeling.
Year |
Variables |
||||
literacy |
Morbidity |
Quality of the social network |
Work and life balance |
Job security |
|
1994 |
18.9 |
15.8 |
20.4 |
12.1 |
44.1 |
1998 |
20.5 |
7.3 |
21.0 |
14.0 |
47.0 |
2003 |
21.8 |
5.9 |
22.1 |
17.9 |
49.7 |
2005 |
23.6 |
11.3 |
24.3 |
8.0 |
33.7 |
2007 |
28.3 |
8.7 |
26.7 |
14.1 |
36.3 |
2015 |
34.5 |
10.0 |
16.5 |
33.6 |
34.0 |
Estimations of economic support ratio, consumption of electricity per capita, gross domestic per capita and inflation rate provided from estimations of Ministry of Economy, Finance and Development. It also important to note that economic support ratio has been estimated in the framework of the demographic dividend profile report by Bahan et al. (2016). The report is based on National Transfer Account (NTA) method with technical support of Centre de Recherche en Economie et Finance Appliquées de Thiès (CREFAT).
3.4. Statistical Analysis Methods
The analysis model that we use is Vector Error Correction Model (VEC). A vector error correction model is one of the categories of multiple time series models used for data where the underlying variables have a long-run stochastic trend known cointegration. It is a theoretically-driven approach useful for estimating short-term and long-term effects of one time series on another. The term error-correction is related to the fact that VEC directly estimates the speed at which a dependent variable returns to equilibrium after a change in other variables.
This approach will be done in three steps: (i) unit root tests, (ii) Johansen cointegration tests, (iii) Granger causality tests as part of an error-correction vector model.
Unit root tests: Unit root tests identify the presence of unit root in a series. A time series is stationary if it has neither trend nor seasonality. The enhanced Dickey-Fuller test is used for this purpose. In this test, we try to verify the null hypothesis against the alternative hypothesis.
Cointegration: Cointegration is used to test the existence of stable long-term relationship between two non-stationary variables, including delay variables and exogenous variables. The analysis of cointegration allows identifying the relationship between two variables, by looking for the existence of a cointegrating vector, and by eliminating its effect if necessary. Two series x and y are cointegrated if the following two conditions are satisfied: they are assigned a stochastic trend of the same order of integration and a linear combination of these series leads to a series of inferior order of integration. Finally, the Johansen cointegration test uses two statistics: the trace statistic and the maximum eigenvalue. The asymptotic distributions of these statistics are non-standard.
Error correction model and causality in the sense of Granger: The presence of a cointegration relationship between two variables leads to the existence of a causal relation between them in at least one direction. This causal relationship can be analyzed through the Granger causality test, which relies on the error correction model (VECM). According to Granger's representation theorem, any cointegrated system implies the existence of an error-correcting mechanism that prevents variables from deviating too far from their long-run equilibrium. In our case, if the two variables studied, namely: Comp and Tour are cointegrated; we deduce that there exists an error-correcting mechanism. The error correction model is a particular form of autoregressive model with staggered delays. It can be interpreted as an adjustment model. The coefficient of the error term is relevant only when it is significant, ie between -1 and 0.
4. Results
4.1. Trend of Social Well-Being Index and Economic Support Ratio
Social well-being index was computed using results of six (6) households living conditions surveys. Based on these results, we estimated the values corresponding to the other years using polynomial interpolation. The results of these estimates have been adjusted. Economic support ratio is provided by demographic dividend profile report (Bahan et al., 2016).
The trend of the curves corresponding of the two indicators shows that they evolve in a similar way in polynomial form with some disturbances in the economic support ratio between 1990 and 2000. The lowest values were obtained over the period 1992-1995. From 1995, the evolution of the two curves seems not only be regular but also ascending. This similar trend between these two curves between 1990 and 2015 indicates the potential causality relationship between social welfare index Figure 1 and economic support ratio Figure 2. The curve of consumption of electricity Figure A1 seems to be linear while for Inflation rate Figure A2 and GDP Figure A3, the trend indicates that the necessity of adjustment.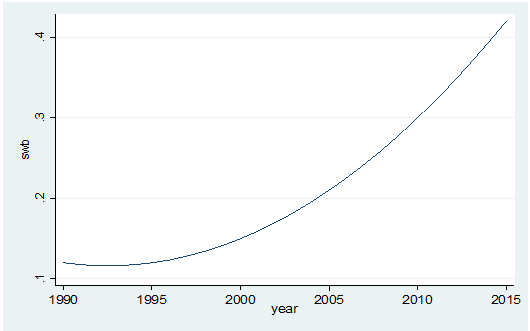
Figure-1. Trend of social well-being index.
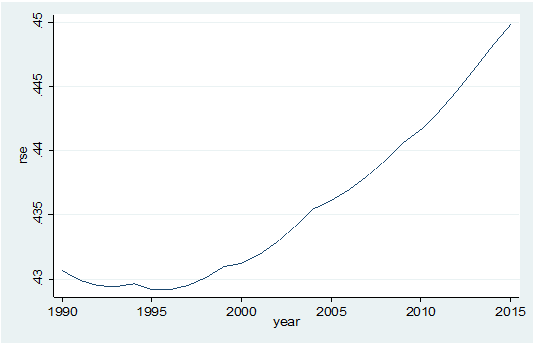
Figure-2. Trend of economic support ratio.
4.2. Tests for Unit Root
Table 2 shows the results of the test of unit root using Augmented Dukey-Fuller unit-root test. According to the test, social well-being, economic support, access drinking water, consumption of electricity per capita, gross domestic per capita and inflation are stationary.
| Variable | Dickey-Fuller test for unit root |
||
Trend |
No constant |
Drift |
|
T-stat |
T-stat |
T-stat |
|
| Social well-being index | -2.208 |
17.78*** |
14.16*** |
| Economic support ratio | -2.486** |
5.453*** |
6.63*** |
| Access to drinking water rate | ---- |
43.08*** |
---- |
| Electrification rate | -1.376 |
9.61*** |
3.4*** |
| Inflation rate | -4.32*** |
-3.16*** |
-4.42*** |
| Ln(GDP per Capita) | -0.314*** |
-1.52 |
2.96 |
| Note: ***; ** represents 1% and 5% level of significance respectively. |
4.3. Tests for Cointegration
Using all variables included in our theoretical model to implement test for cointegration, we find that there is a relation of collinearity between the variables. To solve this problem, we have done many simulations in order to identify the variable source of collinearity. Variable identified is access to drinking water.
We removed the variable of model before determining the rank of cointegration. Table 3 presents the results. Besides presenting information about the sample size and time span, the header indicates that test statistics are based on a model with one lag and a constant trend. The results show that there is one cointegrating relationship. There is a long-run relationship between social well-being index, economic support ratio, electrification rate, inflation rate and Gross Domestic Product per capita in Burkina Faso during the period of study.
| Johansen tests for co integration | ||||||
| Trend: constant | Number of obs = 25 |
|||||
| Sample: 1991- 2015 | Lags = 1 |
|||||
| Maximum Rank | Parms |
LL |
Eigenvalue |
Trace Statistic |
5% Critical Value |
|
0 |
5 |
449.18378 |
. |
160.0011 |
68.52 |
|
1 |
14 |
506.68486 |
0.98995 |
44.9989* |
47.21 |
|
2 |
21 |
519.02995 |
0.62753 |
20.3087 |
29.68 |
|
3 |
26 |
526.38941 |
0.44498 |
5.5898 |
15.41 |
|
4 |
29 |
529.13881 |
0.19744 |
0.0910 |
3.76 |
|
5 |
30 |
529.18431 |
0.00363 |
|||
4.4. Estimations of Parameters of Equations of Short Run and Long-Run Relationship between Demographic Dividend and Social Well Being
Table 4 presents the results of short run and long-run relationship between social well-being, economic support ratio, consumption of electricity per capita, inflation rate and gross domestic per capita. Two models (model 1 and model 2) have been designed. The first model analyzes the relationship between social well-being, economic support ratio, consumption of electricity per capita and gross domestic per capita while the second integrates the inflation rate. At short time, the economic ratio and electricity consumption contribute to the decrease of social well-being, but it is important to note that the coefficient is very low, so that we can conclude there is no impact on social well-being. When the economic ratio increases of 1%, social well-being decreases of 0.003%. Gross domestic per capita has no impact on social well-being.
The coefficient of vector correction model VEC (-1) is negative and significant at the threshold of 1% (VEC (-1) =-0.044). This means that there is long-run relationship between social well-being, economic support ratio, and consumption of electricity per capita, inflation rate and gross domestic per capita. This coefficient represents the speed of adjustment of the short run relationship towards the long-run relationship. When the percentage of effective workers in the population increases, the social well-being is improving. However, the consumption of electricity per capita increases and contributes to decrease social well-being level. Therefore, an increase in economic ratio of 1% contributes to increase the social well-being of 19%. The results also indicate that gross domestic per capita has no impact on social well-being.
According the second model (model 2), at short time, economic ratio and consumption of electricity per capita have positive impact on social well-being but this impact is very low, so that we can say there is no impact of economic ratio and consumption of electricity on social well-being. Regarding the long-run relationship, we note VEC (-1) is negative and significant at 1%. This confirms the existence of mechanisms of correction error with the speed of adjustment of -0.076. Economic ratio has positive impact while electrification rate and inflation have negative impact on social well-being. When, the percentage of effective workers increase in the population, the social well-being is also improving. However, this improving is accompanied with the increase in consumption of electricity per capita and change in inflation rate that contributes to decrease the level of social well-being. The equilibrium is established at long time. The increase in economic ratio of 1% leads to the increase in social well-being of 6.36%.
| Variable | Vector Error-Correction model |
|||
Model 1 |
Model 2 |
|||
| Social well-being index | Short time |
Long time |
Short time |
Long time |
| Economic support ratio | -0.003*** |
19.007** |
0.006*** |
6.36* |
| Consumption of electricity per capita | -0.004*** |
-27.706*** |
0.007*** |
-16.47** |
| Ln (GDP per capita) | 0.151 |
-0.014 |
-0.30 |
-0.01 |
| Inflation rate | -0.314 |
-0.204** |
||
| VEC (-1) | -0.044*** |
-0.076*** |
||
| Constant | -7.499 |
-2.314 |
||
| Note: ***; **; * represents 1% ; 5% and 10% level of significance respectively. |
5. Discussions, Conclusions and Recommendations
The objectives of the paper were to analyze the relation between demographic dividend and social well-being using the different Household Living Conditions Surveys realized in Burkina Faso. Using the vector correction model (VEC), two models have been created: (i) the first model analyses the relation between support ratio (variable measuring demographic dividend) and social well-being, including other variables of control such as consumption of electricity per capita and gross domestic per capita; (ii) the second model also analyses relation between demographic dividend and social well-being, including consumption of electricity per capita, gross domestic per capita and inflation rate as variables of control.
The results indicate that at short time, the impact of demographic dividend on social well-being seems to be very low. The coefficient is statistically significant but, they are very small. Based on these findings, we conclude that demographic dividend and consumption of electricity per capita have no impact on social well-being. However, regarding to the model related to long-run relationship, our findings indicate that demographic dividend is the key driver of social well-being. However, its impact is scale down by the increase in consumption of electricity per capita and inflation rate. Moreover, in the two models, the gross domestic product per capita seems to do not have impact on social well-being. Therefore, when the percentage of workers increase in the population, social well-being also increases but, the improving in social well-being is reduced by the increase in consumption of electricity per capita and inflation rate.
The finding according to which the demographic dividend is the key driver of social well-being confirms the relevance of the interventions in the area of demographic dividend, especially in the Sahel region. One of question regularly asked by Africa decision makers in line with the concept of demographic dividend is to know if demographic dividend would lead to well-being. This paper comes to fill this gap and clarify the necessity to amplify interventions in demographic dividend. The literature is very poor regarding studies analyzing relationship between demographic and social well-being. Multiple past studies are focused on the impact of demographic dividend on economic growth (Lee & Mason, 2007). Mason. and Lee (2004) particularly showed economic growth due to fertility decline is as effective at reducing poverty as other growth policies. Similar results have found by Dramani (2016) who shows that in the case au Senegal, an increase in economic support ratio of 1% leads to an increase in economic growth of 3.7%. The study also confirms the importance of family’s structures in the quest of social well-being as shown by Bahan and Dramani (2020) in the article Le bien-être au Burkina Faso: uelle est la place des structures familiales.
The consumptionof electricity per capita has negative impact on social well-being. The ways through electricity can impact well-being are multiple. For International Atomic Energy Agency (1999) electricity is an invisible and naturally occurring force that can be seen in such natural phenomena as lightning and the shock you sometimes get when you touch metal. When, the consumption of electrify per capita increases, the corresponding budget also increases and the weight in the budget of household becomes important. This could probably explain the negative relationship between this variable and social well-being at long time. Moreover, the cultivation of electricity for human use offers numerous conveniences, but it can also harm the environment and increase health risks to people. This affects negatively social well being. The 2010 Global Burden of Disease comparative risk assessment estimated shows that household air pollution from solid fuels was responsible for 3.5 million premature deaths in 2010, and general outdoor air pollution, which has a large energy component, was responsible for 3.1 million premature deaths in the same year (Smith et al., 2013).
Inflation rate has negative impact on social well-being. We found that the increase of inflation rate of 1% leads the decrease of social well-being of 0.076%. Many previous studies found the similar results regarding negative impact of inflation on social well-being. Inflation is defined as increase in terms of consumer purchasing power or decline in or devaluation of money (Houghton, 2000). It takes place when price level expands more in proportion to output (Shahid, 2010). One of the empirical studies regarding economic development and inflation has been conducted by Robinson (2007). The study concerns 65 countries and showed that inflation is a source of creating uncertainty among people about to think of what would happen tomorrow about purchase of goods and related services. Therefore, it has many negative consequences on families’ lives. For Shahid (2010) the increase in inflation is one of the major sources of creating instability in the economic system, breakdown the level of purchasing power of the common man as well increase in labor wages while affecting the life standards of the society. The findings of Arab, Hafeez-ur-Rehman, Hussain, Khan, and Umar (2019) confirm the conclusions of Robinson and Said. In fact, for the authors, inflation as a social monster has multidimensional impacts upon the social, economic and psychological spheres of poor families, which paralyze their overall development.
The study has some limitations that should be noted. The main limitation is related to the fact that our data are times series but, six (6) households living conditions survey data have been used. The intermediate year’s data have been computed using linear interpolation. It would be better if all data are observed data.
As the findings indicated that the economic support ratio has positive impact on social well-being, it is important to reinforce the investment in the area of demographic dividend. Moreover, taking in consideration the results of Bahan et al. (2016) demographic dividend window opportunity is opened since 1996, and using classification of Groth et al. (2017) policies to be implemented are those related to achieve sufficient conditions. Therefore, in order to capture demographic dividend and improve social well-being, we suggests:
- Government has to amplify the investments in the area of employment, education, economic policies, governance and health in order to harnessing demographic dividend. A particular accent must be put on the opportunities of employment to increase effective workers in the population. Mentorship programs are encouraged to stimulate the creation of employment;
- Government has to improve the sector of energy by only making subventions on the cost of electricity but also encourage the solar energy that has least negative impact on the health of population;
- The findings indicate that inflation has negative impact on the social well-being; it is so important for Government to develop strategy that will help to reduce the impact of inflation in the lives of household.
References
African Institute for Development Policy. (2012). Investments in family planning will stimulate socio-economic development in Africa. Bridging Development Research, Policy & Practice.
Arab, N., Hafeez-ur-Rehman, Hussain, M., Khan, W., & Umar, D. (2019). Socio-psychological consequences of price hike on poor families of District Malakand, Khyber Pakhtunkhwa, Pakistan. International Journal of Business and Social Science, 12(14).
Bahan, D., Bambara, G., Kobiané, J. F., Koncobo, Z. W. O., Sankara, O., & Zongo, L. (2016). Report on the profile of the demographic dividend of Burkina Faso (pp. 79 ). Ministry of Economic, Finance and Development.
Bahan, D., & Dramani, L. (2015). Structure and dynamic of economy and its links with population well-being in Burkina Faso from 1990 to 2015. British Journal of Economics, Management & Trade, 12(1), 1-13.
Bahan, D., & Dramani, L. (2020). Social well-being in Burkina Faso: What is the place of family structures? Journal of Economics and Development Studies, 8(1).
Barro, R., & Sala-I-Mart, X. (2004). Economic growth (2nd ed.). Cambridge: MIT Press.
Barro., R., & Sala-I-Martin, X. (1995). Economic growth. New York: McGraw-Hill.
Bloom, D. E., Canning, D., Fink, G., & Finlay, J. E. (2009). Fertility, female labor force participation, and the demographic dividend. Journal of Economic Growth, 14(2), 79-101. Available at: https://doi.org/10.1007/s10887-009-9039-9.
Bloom, D. E., & Williamson, J. G. (1998). Demographic transitions and economic miracles in emerging Asia. The World Bank Economic Review, 12(3), 419-455. Available at: https://doi.org/10.1093/wber/12.3.419.
Bloom., D. E., Sachs, J. D., Collier, P., & Udry, C. (1998). Geography, demography, and economic growth in Africa. Brookings Papers on Economic Activity, 1998(2), 207-295. Available at: https://doi.org/10.2307/2534695.
Bloom.., E. D., Canning, D., & Malaney, N. P. (2000). Demographic change and economic growth in Asia. Population and Development Review, 26(supp), 257–290.
Bloom.., E. D., Canning, D., & Sevilla, J. (2003). The demographic dividend: A new perspective on the economic consequences of population change. Santa Monica, CA: RAND Corp.
Bloom..., D., & Canning, D. (2004). Global demographic changes: Dimensions and economic significance. NBER Working Paper 10817, National Bureau of Economic Research, Inc.
Canning, D., Sangeeta, R., & Abdo, S. Y. (2016). Africa's demographic transition: dividend or disaster? The developing Africa collection. Washington, DC: World Bank.
Cutler, D. M., Poterba, J. M., Sheiner, L. M., Summers, L. H., & Akerlof, G. A. (1990). An aging society: Opportunity or challenge? Brookings Papers on Economic Activity, 1990(1), 1-73. Available at: https://doi.org/10.2307/2534525.
Dramani, L. (2016). Impact of the demographic dividend on economic growth in Senegal. African Population Studies, 30(2).
Economic Commission for Africa. (2013). Create and capitalize on the demographic dividend in Africa. Industrialization for emerging Africa, 21-26 March 2013. Paper presented at the Generation Systems: Procedures for Comparative Assessment. Technical Reports Series No. 394T.
Groth, H., May, J.-F., & Turbat, V. (2017). Policies needed to capture a demographic dividend in Sub-Saharan Africa. Canadian Studies in Population, 46(1), 61–72. Available at: https://doi.org/10.1007/s42650-019-00005-8.
Guengant, J. P. (2011). How to benefit from the demographic dividend? : Demography at the center of development trajectories in WAEMU countries as well as in Guinea, Ghana, Mauritania and Nigeria: Regional synthesis (pp. 33). Paris: AFD.
Guengant, J. P. (2017). Africa’s population: History, current status, and projections. In H. Groth & J. F. May (Eds.), Africa’s population: In search of a demographic dividend (pp. 11–31). Cham: Springer.
Hayes, A., & Setyonaluri, D. (2015). Taking advantage of the demographic dividend in Indonesia: A brief introduction to theory and practice. United Nations Population Fund: New York, NY, USA.
Houghton, M. (2000). The American heritage dictionary of the English language (4th ed.).
International Atomic Energy Agency. (1999). Health and environmental impacts of electricity generation systems: Procedures for comparative assessment (pp. 204). Technical Reports Series N0394.
Lee, S.-H., & Mason, A. (2007). Who gains from the demographic dividend? Forecasting income by age. International Journal of Forecasting, 23(4), 603-619. Available at: https://doi.org/10.1016/j.ijforecast.2007.07.004.
Lutz, W. (2014). The demographic dividend is an education-triggered dividend. Population Network Newsletter, No. 45.
Maslow, A. (1943). A theory of human motivation. Psychological Review, 50(4), 370-396.
Mason, A. (2005). Demographic transition and demographic dividends in developed and developing countries. Paper presented at the United Nations Expert Group Meeting on Social and Economic Implications of Changing Population Age Structure, Mexico City, August 31-September 2.
Mason, A., & Lee, R. (2007). Transfers, capital, and consumption over the demographic transition, in population aging, intergenerational transfers and the macro economy, Robert Clark, Naohiro Ogawa, and Andrew Mason (Eds) (pp. 128-162). Cheltenham, UK: Edward Elgar.
Mason., A., & Lee, R. (2004). The demographic dividend and poverty reduction. Paper presented at the Seminar on the Relevance of Population Aspects for Achievement of Millennium Development Goal.
Mehrotra, S. (2015). Realizing the demographic dividend: Policies to achieve inclusive growth in India. Cambridge: Cambridge University Press.
Moreland, S. (2017). Can Nigeria attain demographic dividend? African Population Studies, 31(1).
Moreland, S., Madsen, E. L., Kuang, B., Hamilton, M., Jurczynska, K., & Brodish, P. (2014). Modeling the demographic dividend: Technical guide to the DemDiv model. Washington, DC: Futures Group, Health Policy Project.
Nayihouba, A. (2015). Demographic dividend and economic growth: What prospects for Africa? STATECO N ° 109.
Ndulu, J. B., Chakraborti, L., Lijane, L., Ramachandran, V., & Wolgin, J. (2007). Challenges of African growth: Opportunities, constraints, and strategic directions. Washington D.C: World Bank.
Robinson, K. (2007). Fighting inflation. Graduate Degree Based Thesis, The University of Central Missouri Warrensburg.
Shahid, H. (2010). Macro economics (pp. 333): Awan Printing Press.
Smith, R. K., Frumkin, H., Balakrishnan, K., Butler, D. C., Chafe, A. Z., Fairlie, I., . . . Schneider, M. (2013). Energy and human health. Annual Review Public Health, 34, 159–188.
Tim, M., Ciro, M., Paulo, S., & Holz, M. (2008). The impact of the demographic dividend on three key support system: Education, health care and pensions. Paper presented at the Paper to be Presented at the Expert Group Meeting on Mainstreaming Age Structure Transitions into Economic Development and Policy Planning, 7-9 October 2008.
United Nations. (2017). Support ratios and demographic dividends: Estimates for the world. New York: United Nations Population Division Technical Paper 2017/1.
Annexes
| Johansen tests for co integration | ||||||||
| Trend: constant | Number of obs = 25 |
|||||||
| Sample: 1991- 2015 | Lags = 1 |
|||||||
| Maximum Rank | Parms |
LL |
Eigenvalue |
Trace Statistic |
5% Critical Value |
|||
0 |
4 |
407.56048 |
. |
131.9884 |
47.21 |
|||
1 |
11 |
462.53376 |
0.98770 |
22.0418* |
29.68 |
|||
2 |
16 |
469.94329 |
0.44720 |
7.2227 |
15.41 |
|||
3 |
19 |
473.48277 |
0.24660 |
0.1438 |
3.76 |
|||
4 |
20 |
473.55466 |
0.00573 |
|||||
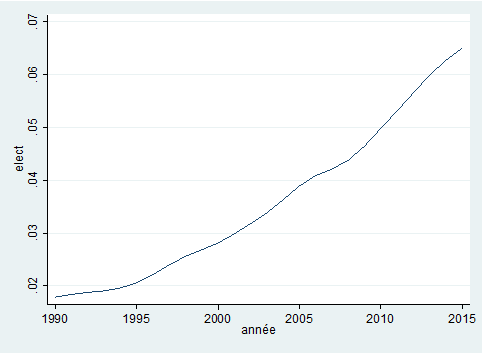
Figure-A1. Trend of consumption of electricity per capita.
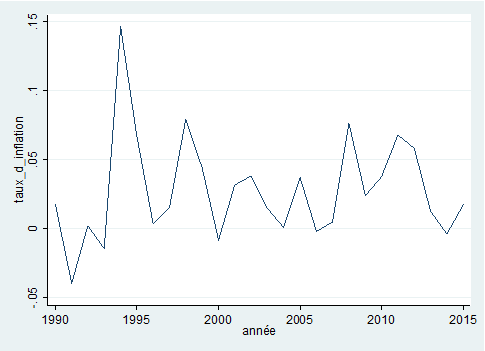
Figure-A2. Trend of inflation rate.
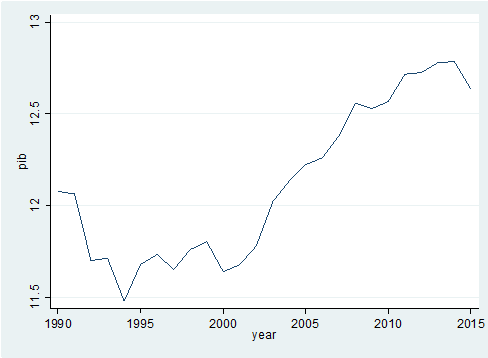
Figure-A3. Trend of GDP per capita.
Footnotes:
1. Employment dependency ratio (EDR) is defined as the number of people that are unemployed (or inactive), whatever their age, divided by number people that are working (or active), whatever their age.
2. Socioeconomic dependency ratio (SDR) is defined as the number of people that have a total consumption higher than their total income divided by the number of people that have a total income higher than their total consumption.