Inflation and Economic Growth in Zimbabwe is there Any Inflation Threshold Level?
Raynold Runganga
University of Zimbabwe, Department of Economics, Harare, Zimbabwe. |
AbstractThis study examines the existence of threshold level as well as the relation between inflation and economic growth in Zimbabwe using annual data for the period 1981 to 2018. While the Dynamic Ordinary Least Squares (DOLS) shows that inflation has a negative impact on economic growth and the share of gross capital formation in gross domestic product has positive impact on economic growth, Engle-Granger test shows that there is long-run relationship between the variables. The conditional least squares shows that there is a non-linear relationship between inflation and economic growth. The threshold level of inflation above which additional increase in inflation slows economic growth is 4 per cent. Inflation below the threshold level of 4 per cent has significant positive impact on economic growth but this effect turns out to be negative when inflation rise above the threshold level of inflation. The findings also show that low inflation has a positive impact on economic growth. The study results imply that policy makers should ensure that inflation is kept below the threshold level of 4 per cent and this should be the inflation target in order to achieve higher economic growth. |
Licensed: |
|
Keywords: JEL Classification |
|
Received: 14 August 2020 |
Funding: This study received no specific financial support. |
Competing Interests: The author declares that there are no conflicts of interests regarding the publication of this paper. |
1. Introduction
One of the most fundamental objectives of macroeconomic policy in any country in the world is the attainment of high and sustained economic growth in conjunction with low and stable inflation. While low inflation has been widely accepted as the necessary condition for growth, there is no consensus both at the level of theory and in empirical literature on the relationship between inflation and economic growth. While the modern Phillips curve1 analysis on inflation provides for the existence of trade-off between achieving low inflation and high sustained economic growth, studies show that there is a certain inflation level where this condition does not hold for they found a threshold level of inflation for economic growth to exist (Drukker, Pedro, & Paula, 2005; Hasanov, 2011; Iqbal & Nawaz, 2009; Khan & Senhadji, 2001; Masiyandima, Ngundu, Kupeta, Moyo, & Ngwenya, 2018; Sarel, 1996; Sattarov, 2011). Incorporating inflation expectations ignored by the Phillips curve, the monetarist, Friedman (1968) pointed out that in the long run, there is no trade-off between inflation and economic growth. According to Khan and Senhadji (2001) it is generally accepted that inflation has a negative impact on medium and long-term growth and if high inflation is detrimental to growth, how low should inflation be to achieve high economic growth?
Various schools of thought exist which provide different views on the relationship between inflation and economic growth. For instance, while the structuralists believe that inflation is essential for economic growth, the monetarists argue that inflation is harmful to economic growth (Mallik & Chowdhury, 2001). Drukker et al. (2005) highlighted on the four principal predictions in literature regarding the impact of inflation on output and growth and these are: (a) The prediction that there is no effect of inflation on growth as established by Sidrauski (1967) when he showed that money is neutral and super-neutral; (b) An assumption by Tobin (1965) that money is a substitute for capital, causing inflation to have a positive impact on long-run growth; (c) Money is a complementary to capital as presented by Stockman (1981) in cash in advance model, causing inflation to have a negative impact on long-run growth; (d) A new class of models in which inflation has a negative impact on long-run growth, but only when inflation level exceeds the threshold level. These various predictions shows that the relationship between inflation and economic growth is unclear, which has motivated this study to investigate the relation between inflation and economic growth within the Zimbabwean context.
Since the goal of any Central Bank is to maintain low inflation based on the general consensus that high inflation is harmful to growth, an important question would be; what is the lowest possible inflation level desired to attain highest possible growth? This has been observed through the use of threshold models because at some low levels of inflation, inflation might be positively related to growth and at some higher levels of inflation, inflation might be negatively related to economic growth. Although Masiyandima et al. (2018) estimated the threshold level of inflation for economic growth in Zimbabwe using quadratic threshold model, this study improves by using conditional least squares for the threshold level of inflation is unknown and it enters the regression in a non-linear and non-differentiable manner (Khan & Senhadji, 2001). The study also used Dynamic Ordinary Least Squares (DOLS) for it is suitable for small sample size and it account for the possibility of regressor endogeneity.
The Zimbabwean economy went through a series of high inflationary periods and undesirable gross domestic product growth during the period of post-independence from 1981 to 2018. An analysis of inflation history in Zimbabwe shows that the country experienced on average high annual inflation like many developing countries that experienced high inflation in the 1980s and 1990s Masiyandima et al. (2018).
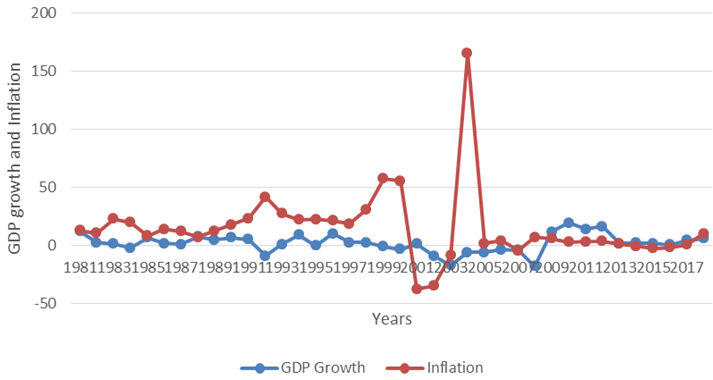
Figure-1. Inflation and gross domestic product growth.
As shown in Figure 1, annual inflation rose from 13.15 per cent in 1981 to 23.12 per cent in 1983 and this increase might be a reflection of the impact of 1982 drought which caused escalation of food prices. During the same period when inflation was rising, real GDP growth rate was falling until it reached -1.91 per cent in 1984 and this was also a reflection of the impact of drought on economic growth. As annual inflation fell from 23.12 per cent in 1983 to 8.49 per cent in 1985, real GDP growth rose until it reached 6.94 per cent in 1985. When annual inflation rose from 8.49 per cent in 1985 to 14.33 per cent in 1986, real GDP growth was falling until it reached 1.15 per cent in 1987 before it rose to 7.55 per cent in 1988. During the period 1988 to 1992, inflation rose from 7.42 per cent to 42 per cent and real GDP growth fell from 7.55 per cent to -9.02 per cent during the same period. A sharp rise in inflation and a steep decline in real GDP growth during the period 1991 to 1992 reflect the impact of the severe 1992 drought. From the year 1996, there was a decline in real GDP growth rate from 10.36 per cent until it reached -17 per cent in 2003 and as the economy was experiencing negative inflation, negative growth rate resulted.
The Zimbabwean economy flipped into economic crisis in 1998, emanating from several structural rigidities which were not successfully addressed during the Economic Structural Adjustment Programme, Zimbabwe Program for Economic and Social Transformation and this crisis also reflected inconsistencies in macroeconomic policies (Masiyandima et al., 2018). From the last quarter of 1997, there was a rapid and sustained loss of value of the Zimbabwean dollar which led to its abandonment in 2009. Negative economic growth rate was recorded during the hyperinflation period which bottomed -17.67 per cent per cent in 2008 and it ended abruptly following the adoption of multicurrency regime in 2009, bringing sanity to the financial sector. From 2009, there was a fall in inflation until it reached negative inflation of -2.41 per cent in 2015 and during that period, real GDP growth rose from -17.67 per cent in 2008 to 16.67 per cent in 2012 before falling to 1.63 per cent in 2013. During the period 2009 to 2012, year-on-year inflation averaged below 5 percent and appreciation of the United States dollar among other drivers resulted in deflation being experienced in 2014 with annual inflation reaching -2.41 per cent in 2015 (Kavila & Le Roux, 2016; Masiyandima et al., 2018). As inflation was falling from 2013 to 2016, real GDP growth was also falling and as inflation rose from 2016 reaching 10.5 per cent in 2018, real GDP growth also rose until it reached 6.16 per cent in 2018.
In 2014, the Reserve Bank of Zimbabwe (RBZ) introduced the bond coins pegged at 1:1 with the United States dollar and bond notes were later introduced in 2016. Towards the end of 2017, the Zimbabwean economy started to experience inflationary pressures and the annual inflation which had been trending below 5 per cent for the greater part of 2018 spiked to 21 per cent in October 2018 and further to 42.1 per cent in December 2018. Inflationary pressure was experienced, maybe due to speculative behavior and increase in parallel market rates for foreign exchange. With the abandonment of multicurrency regime, month-on-month inflation slowed down during the second half of the year to 17.7 per cent in September 2019 from 39.3 in June 2019. In 2019, inflation accelerated from 56.9 per cent in January 2019 to 175.5 per cent in June 2019. Although economic growth increased to 6.16 per cent in 2018 from 4.70 per cent in 2017, it was projected to decline to -6.5 per cent in 2019.
Figure 1 shows that during the period when inflation was rising, real GDP growth was falling and when inflation was too high, negative growth rates were recorded. When inflation was positive but below 6 per cent, for instance, from 2009 to 2012, highest real GDP growth rates were recorded and there may be a threshold level of inflation that maybe conducive for growth. With both high inflation and deflation being detrimental to growth, it therefore need an investigation on the relationship between inflation and economic growth and the optimal level of inflation which maximises growth in Zimbabwe. Examining the threshold inflation level and the nature of the relationship between inflation and economic growth is crucial for policy implementation in order to keep inflation level at the desired level that enhances growth. Due to controversial issues regarding the relationship between inflation and economic growth, it is against this backdrop that this papers seeks to examine the relationship between inflation and economic growth and establish the threshold inflation level in Zimbabwe.
The rest of the paper is organised as follows: Section 2 reviews the main theoretical and empirical literature while section 3 provides the methodology used in the study. Section 4 presents the econometric results and section 5 presents the conclusion from the study.
2. Theoretical and Empirical Literature
Several theories exist in explaining inflation-growth relationship and this study particularly focus on the Phillips curve theory, Monetarist and Neo-classical theories. The modern Phillips curve brought by Phillips (1958) shows a negative relationship between inflation and unemployment in the short run and this led to the Keynesian idea that employment/ economic growth can be increased by tolerating higher inflation. Hence, high inflation leads to high economic growth via high employment in the short run. While the inflation-unemployment trade off provide policy makers with a menu of choices2 , this relationship fell apart in the late 1960s and 1970s as most advanced economies experienced high inflation and high unemployment simultaneously. Thus, while an increase in inflation reduces unemployment/ increase economic growth based on the Phillips curve, this relationship failed to hold indefinitely, implying the existence of inflation threshold. Friedman (1968) pointed the serious flaw in the Phillips curve analysis, arguing that there is not one Phillips curve but a series of short run Phillips curve and a long run Phillips curve which exist at the natural rate of unemployment. In the long run, there is no trade-off between inflation and unemployment because of the existence of economic agents’ expectations of inflation, an argument brought by Monetarists in explaining the collapse of the Phillips curve.
In addition to Phillips curve theory, Monetarist theory pioneered by Milton Friedman points out that changes in money supply is the most determinant of economic growth. Thus, business cycles are a reflection of changes in money supply and inflation arise when money supply increase at faster rate than growth in national income. When money supply increases at a faster rate than the growth in national income, it result in inflation which would be harmful to growth. Besides economic growth being driven by inflation, high inflation can also result from high economic growth based on the demand pull inflation argument. An increase in national income increases the purchasing power of economic agents, resulting in high demand of goods and services, promoting demand pull inflation. Thus, endogeneity may exist between inflation and economic growth. However, the Neo-classical growth theory pioneered by Solow (1956) and Swan (1956) specifies that economic growth is driven by capital, labour and technological progress. De Gregorio (1996) explains how inflation affect economic growth based on the neo-classical approach, arguing that if individuals can choose between consumption and leisure, an increase in inflation rate raises the price of consumption relative to price of leisure, inducing a decrease in the supply of labour as individuals substitute from consumption to leisure. Thus, increase in inflation rate reduce supply of labour resulting in inefficiency in investment and low growth.
In addition to the theoretical relationship between inflation and economic growth, empirical studies provide inconclusive results regarding this relationship. Some studies focused on the relationship between inflation and economic growth, others aimed at determining the threshold level of inflation while others were mainly concerned on both the relationship and the threshold level of inflation for economic growth. Although the results of these studies have been inconclusive, using different methodologies, on average, most of the studies found that the relationship is non-linear. From the studies that primarily focused on the relationship between inflation and economic growth, a negative relationship was found by Quartey (2010); Mamo (2012) and Gokal and Hanif (2004). However, some studies found that inflation has no impact on economic growth (Faria & Carneiro, 2001; Sidrauski, 1967; Svigir & Miloš, 2017) whilst Mavikela, Mhaka, and Phiri (2019) found that inflation is positively related to growth at high inflation levels in Ghana and Tobin (1965) established a positive impact of inflation on growth. These studies found different and inconclusive results with regard to the relationship between inflation and economic growth.
Besides these studies that were primarily interested in the relationship between inflation and economic growth, some studies examined both the relationship and the existence of the threshold inflation level. Different approaches were used to examine the threshold level of inflation including non-linear models, dynamic threshold regression models, conditional least squares, quadratic threshold model and panel smooth transition regression (Behera & Mishra, 2017; Doguwa, 2012; Drukker et al., 2005; Gurgul & Lach, 2014; Hasanov, 2011; Iqbal & Nawaz, 2009; Khan & Senhadji, 2001; Makuria, 2013; Masiyandima et al., 2018; Ndoricimpa, 2017; Sarel, 1996; Sattarov, 2011). While Khan and Senhadji (2001) found a threshold level of inflation of 1-3 per cent for industrial countries and 11-12 per cent for developing countries, Sarel (1996) found a threshold inflation rate of 8 per cent. Drukker et al. (2005) found one threshold of 19.16 per cent and for industrialised countries, the study found two threshold points of 2.57 per cent and 12.61 per cent. In Nigeria, Doguwa (2012) found threshold level of inflation ranging from 10.5 per cent to 12 per cent while Iqbal and Nawaz (2009) found only one threshold inflation level of 7 per cent after using both linear and non-linear models.
In Azerbaijani, Hasanov (2011) found a threshold level of inflation for GDP of 13 per cent while Sattarov (2011) found an optimal inflation rate of 4 per cent in Finland. While Thanh (2015) found an inflation threshold level of 7.84 per cent, Gurgul and Lach (2014) found two inflation threshold levels to equal 1.4 per cent and 3.4 per cent for one year-lagged and contemporaneous effects, respectively. In India, Behera and Mishra (2017) found an inflation threshold level of 4 per cent while in Ethiopia, Makuria (2013) found 10 per cent as the optimal level of inflation that facilitate growth. Ndoricimpa (2017) found an inflation threshold of 6.7 per cent for the whole sample of African countries, 9 per cent for the sub-sample of low income countries and 6.5 per cent for middle income countries. In Zimbabwe, Masiyandima et al. (2018) found an inflation threshold level of 8.7 per cent for the period 1980 to 1997 and 4.6 per cent for the multicurrency regime period 2009 to 2017.
In summary, both theoretical and empirical literature are inconclusive and inconsistent both on the relationship between inflation and economic growth and on the threshold level of inflation. However, most of the studies concluded that the relationship between the variables is non-linear and there is a threshold effect. Inflation has a positive impact on growth below the threshold level and has a detrimental effect on economic growth when inflation exceed the threshold level. Although this study has been done by Masiyandima et al. (2018) who used the quadratic threshold model in Zimbabwe to determine the threshold level, this study uses a different methodology, DOLS to account for the possibility of endogeneity between inflation and economic growth, and the conditional least squares method which has been widely accepted in literature.
3. Methodology and Data
3.1. Empirical Model
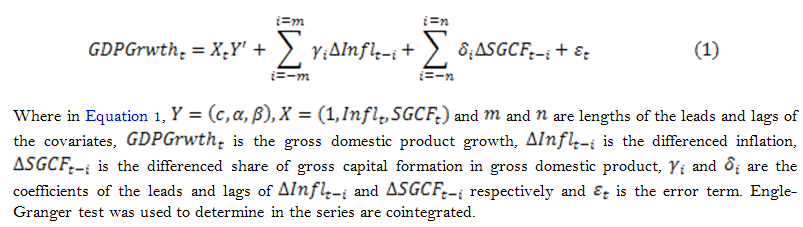
In order to examine the relationship between inflation and economic growth, the study used DOLS by Stock and Watson (1993) which improves on Ordinary Least Squares (OLS) by copying with small sample size and dynamic sources of bias. It also account for the possibility of regressor endogeneity by inclusion of leads and lags of first differences of endogenous 3. The DOLS regression equation was specified as follows:
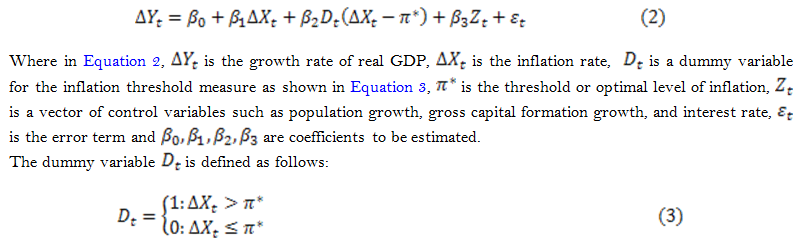
3.2. Threshold Model and the Estimation Method
In order to detect the potential non-linear relationship between inflation and economic growth and estimate the threshold level of inflation, the study used the methodology proposed by Khan and Senhadji (2001) and used by Doguwa (2012) in Nigeria, Iqbal and Nawaz (2009) in Pakistan, Hasanov (2011) in Azerbaijani, Makuria (2013) in Ethiopia and Behera and Mishra (2017) in India. In order to determine the threshold level of inflation, the following econometric model was estimated.
According to Hasanov (2011) the relationship between inflation and economic growth in shown by (i) ![]() low inflation and (ii)
low inflation and (ii) ![]() , high inflation and when the coefficient of inflation is significant, then the impact of inflation on economic growth would be
, high inflation and when the coefficient of inflation is significant, then the impact of inflation on economic growth would be ![]() . If
. If ![]() was known, then the Ordinary Least Squares could be used but since
was known, then the Ordinary Least Squares could be used but since ![]() is unknown, it has to be estimated with other parameters, making non-linear least squares (NLLs) estimation a better method. However, Khan and Senhadji (2001) argue that since
is unknown, it has to be estimated with other parameters, making non-linear least squares (NLLs) estimation a better method. However, Khan and Senhadji (2001) argue that since ![]() enters the regression in a non-linear and non-differentiable manner, conventional gradient search techniques to implement the NLLs are inappropriate and therefore, the conditional least squares is more appropriate method as used in this study. Since the optimal level of inflation is unknown, different values of
enters the regression in a non-linear and non-differentiable manner, conventional gradient search techniques to implement the NLLs are inappropriate and therefore, the conditional least squares is more appropriate method as used in this study. Since the optimal level of inflation is unknown, different values of ![]() are chosen arbitrarily from
are chosen arbitrarily from ![]() and the threshold level of inflation is the one that minimises the sum of squared residuals or maximises the coefficient of determination (R-squared) from the respective regressions. The estimation method 4 has been widely accepted in literature and several regressions have to be estimated until the optimal inflation rate
and the threshold level of inflation is the one that minimises the sum of squared residuals or maximises the coefficient of determination (R-squared) from the respective regressions. The estimation method 4 has been widely accepted in literature and several regressions have to be estimated until the optimal inflation rate ![]() that maximise the coefficient of determination has been obtained.
that maximise the coefficient of determination has been obtained.
Before any estimations were done, stationarity5 test was done using the Augmented Dickey-Fuller test to prevent the possibility of spurious regression. The Augmented Dickey-Fuller test was preferred because it accommodate some form of serial correlation, thus allowing some higher order autoregressive processes in the error term (Greene, 2003). The existence of serial autocorrelation was tested using Breusch-Godfrey test. In order to test for normality of residuals, Skewness and Kurtosis test for normality was used and Breusch-Pagan test was also used to test for heteroscedasticity.
3.3. Data Sources
This study used annual data for the period 1981-2018 and the variables included in the study are growth rate of real GDP (GDPgrwth), change in consumer price index (inflation) and population growth, gross capital formation growth, gross capital formation as a percentage of GDP and lending rate. Data on consumer price index, population growth, gross capital formation as percentage of GDP and gross capital formation growth was obtained from the African Development Bank website while data on growth rate of real GDP (GDPgrwth) was obtained from World Development Indicators. Data on lending rate was obtained from Zimbabwe National Statistics Agency website (ZimStat).
4. Econometric Procedure
4.1. Stationarity Test
The Augmented Dickey-Fuller unit root test was used to determine whether the variables are non-stationary and the results are shown in Table 3. ADF unit root test show that all the variables are stationary in levels, that is they are I(0). Equation 1 was estimated to examine the relationship between inflation and economic growth while Equation 2 was estimated to analyse if there is any threshold effect of inflation on economic growth.
There may be endogeneity problem in equation 1 because there are other variables such as money supply and exchange rate that influence economic growth but are correlated with inflation and thus, Equation 1 was estimated using DOLS. Equation 2 was estimated for different levels of ![]() from
from ![]() in order to determine the optimal level of inflation. Following Hasanov (2011) Equation 2 was estimated using the Ordinary Least Squares (OLS) estimation technique. The optimal or threshold level of inflation was found to be 4 per cent as
in order to determine the optimal level of inflation. Following Hasanov (2011) Equation 2 was estimated using the Ordinary Least Squares (OLS) estimation technique. The optimal or threshold level of inflation was found to be 4 per cent as ![]() minimise the sum of squared residuals or maximise the coefficient of determination. With
minimise the sum of squared residuals or maximise the coefficient of determination. With![]() , the estimated regression model6 shows that there is no problem of serial autocorrelation and heteroscedasticity and residuals are normally distributed.
, the estimated regression model6 shows that there is no problem of serial autocorrelation and heteroscedasticity and residuals are normally distributed.
4.2. Interpretation of Econometric Results
The results from the DOLS show that inflation has a negative impact on economic growth while gross capital formation as a percentage of GDP has a positive impact on economic growth. A 1 per cent increase in inflation reduces economic growth by 0.27 per cent while a 1 per cent increases in share of gross capital formation in GDP increases economic growth by 1.5 per cent, ceteris paribus. The Engle-Granger cointegration test showed that the series are cointegrated and there is a long run relationship between the inflation, economic growth and share of gross capital formation in GDP. The DOLS and Engle-Granger cointegration test results are shown in Table 1 in appendix section.
Conditional least squares econometric results show that low inflation has a positive impact on economic growth and the threshold level of inflation for GDP growth in Zimbabwe is 4 percent. The results of the study are consistent with the findings of Sattarov (2011) who found an optimal inflation rate of 4 per cent for the Finnish economy, Behera and Mishra (2017) who found a threshold level of inflation of 4 per cent in India, Masiyandima et al. (2018) who found an optimal level of inflation of 4.6 per cent for the multicurrency regime (2009-2017) and 8.7 per cent for the period 1980 to 1997 in Zimbabwe, Singh (2010) who found a threshold level of inflation for India at 6 per cent, Iqbal and Nawaz (2009) who obtained 6 per cent inflation rate to be growth maximising in Pakistan, Sarel (1996) who found a threshold level of inflation of 8 per cent, Khan and Senhadji (2001) who found a threshold level of inflation for developing countries to be 11 per cent to 12 per cent, Hasanov (2011) who found an optimal inflation rate of 13 per cent for Azerbaijani economy and Ndoricimpa (2017) who found inflation threshold of 6.7 per cent for African countries and 9 per cent for low-income countries. The study findings also show that lending rate has a negative impact on economic growth, where a 1 per cent increase in lending rate decreases economic growth by 0.0008881 per cent. However, population growth and gross capital formation growth were found to have no impact on economic in Zimbabwe. This may be explained by the fact that despite an increase in population, the majority of the population is employed in the informal sector which does not contribute to the official estimates of gross domestic product.
Based on the results in Table 2, inflation rate below 4 per cent has a positive impact on economic growth and this effect becomes negative when inflation rate rises over and above 4 per cent. Therefore, the optimal or threshold level of inflation that maximises economic growth is 4 per cent and this result is close to the optimal inflation found by Masiyandima et al. (2018) in Zimbabwe. A one per cent increase in inflation rate above 4 per cent result in a decline in economic growth by 0.079 per cent. Although the coefficient of determination is low, below 50 per cent, it is consistent with the finding of other studies such as Svigir and Miloš (2017) 11.88 per cent in Austria and 1.2 per cent in Italy, Behera and Mishra (2017) 2.72 per cent in India, Masiyandima et al. (2018) 12.53 per cent, Iqbal and Nawaz (2009) 31 per cent and Khan and Senhadji (2001) 39 per cent. It is important to note that the optimal level of inflation is not uniform across countries and it is country specific as found by previous studies.
5. Conclusion and Policy Implications
This study examined the relationship and the existence of a threshold level of inflation for economic growth in Zimbabwe using annual data for the period 1981-2018. The results show that there is non-linear relationship between inflation and economic growth and the threshold level of inflation to promote GDP growth is 4%. Thus, inflation rate below 4% was found to be positively related to economic growth and this positive impact turns out to be negative for inflation rate above 4%. A one percent increase in inflation from 4% result in a decline in economic growth by 0.078 per cent. In addition, the study also find that inflation has a negative impact on economic growth and there is a long run relationship between inflation, economic growth and share of gross capital formation in GDP. The findings of this study are useful to policy makers in the sense that in order to achieve high economic growth, there is need to keep inflation rate to a maximum of 4%. Since the inflation rate in most of the years covered by the study (1981-2018) was above 4%, this shows that the Reserve Bank of Zimbabwe is failing to achieve its core mandate of keeping a low level of inflation. However, it should be noted that the sample size used in this study is small (1981-2018) based on data availability and a similar study can be done with a bigger sample size.
References
Behera, J., & Mishra, A. K. (2017). The recent inflation crisis and long-run economic growth in India: An empirical survey of threshold level of inflation. South Asian Journal of Macroeconomics and Public Finance, 6(1), 105-132.
De Gregorio, J. (1996). Inflation, growth, and central banks: Theory and evidence. Policy Research Working Paper Series 1575, The World Bank.
Doguwa, S. I. (2012). Inflation and economic growth in Nigeria: Detecting the threshold level. CBN journal of Applied Statistics, 3(2), 99-124.
Drukker, D., Pedro, G. P., & Paula, H. E. (2005). Threshold effects in the relationship between inflation and growth: A new panel-data approach. MPRA Paper 38225, University Library of Munich, Germany.
Faria, J. R., & Carneiro, F. G. (2001). Does high inflation affect growth in the long and short run? Journal of Applied Economics, 4(1), 89-105.
Friedman, M. (1968). The role of monetary policy (Vol. 58). New York: American Economic Review.
Gokal, V., & Hanif, S. (2004). Relationship between inflation and economic growth. Working Paper Series No. 2004/04, Economics Department, Reserve Bank of Fiji.
Greene, W. H. (2003). Econometric analysis (7th ed.). New York: Pearson Education India, Inc.
Gurgul, H., & Lach, Ł. (2014). The nexus between i rate and economic growth of polish provinces after EU Accession. Economic Studies, 206, 20-33.
Hasanov, F. (2011). Relationship between inflation and economic growth in Azerbaijani economy: Is there any threshold effect? Asian Journal of Business and Management Sciences, 1(1), 1-11.
Iqbal, N., & Nawaz, S. (2009). Investment, inflation and economic growth nexus. The Pakistan Development Review, 48(4), 863-874. Available at: https://doi.org/10.30541/v48i4iipp.863-874 .
Kavila, W., & Le Roux, P. (2016). Inflation dynamics in a dollarised economy: The case of Zimbabwe. Southern African Business Review, 20(1), 94-117.
Khan, M. S., & Senhadji, A. S. (2001). Threshold effects in the relationship between inflation and growth. IMF Staff Papers, 48(1), 1-21.
Makuria, A. G. (2013). The relationship between inflation and economic growth in Ethiopia. Doctoral Dissertation.
Mallik, G., & Chowdhury, A. (2001). Inflation and economic growth: Evidence from four south Asian countries. Asia-Pacific Development Journal, 8(1), 123-135.
Mamo, F. (2012). Economic growth and inflation: A panel data analysis. Södertörn University, Department of Social Sciences, Economics. Master Programme Thesis.
Masiyandima, N., Ngundu, T., Kupeta, K., Moyo, P. S., & Ngwenya, S. (2018). Optimal inflation for Zimbabwe. RBZ Working Paper Series No.1. 2018.
Mavikela, N., Mhaka, S., & Phiri, A. (2019). The inflation-growth relationship in SSA inflation-targeting countries. Studia Universitatis Babes-Bolyai Oeconomica, 64(2), 84-102.
Ndoricimpa, A. (2017). Threshold effects of inflation on economic growth in Africa: Evidence from a dynamic panel threshold regression approach. African Development Bank Working Paper, No. 249.
Phillips, A. W. (1958). The relation between unemployment and the rate of change of money wage rates in the United Kingdom, 1861-1957. Economica, 25(100), 283-299.
Quartey, P. (2010). Price stability and the growth maximizing rate of inflation for Ghana. Modern Economy, 1(03), 180-194.
Sarel, M. (1996). Nonlinear effects of inflation on economic growth. Staff Papers, 43(1), 199-215.
Sattarov, K. (2011). Inflation and economic growth. Analyzing the Threshold Level of Inflation: Case Study of Finland, 1980-2010, Spring 2011, Master's Program in Economics Thesis, 120 ECTS, UMEA Universitet.
Sidrauski, M. (1967). Rational choice and patterns of growth in a monetary economy. The American Economic Review, 57(2), 534-544.
Singh, P. (2010). Searching threshold inflation for India. Economics Bulletin, 30(4), 3209-3220.
Solow, R. M. (1956). A contribution to the theory of economic growth. The Quarterly Journal of Economics, 70(1), 65-94.
Stock, J. H., & Watson, M. W. (1993). A simple estimator of cointegrating vectors in higher order integrated systems. Econometrica: Journal of the Econometric Society, 61(4), 783-820.
Stockman, A. C. (1981). Anticipated inflation and the capital stock in a cash-in-advanced economy. Journal of Monetary Economics, 8(3), 387-393. Available at: https://doi.org/10.1016/0304-3932(81)90018-0 .
Svigir, M., & Miloš, J. (2017). Relationship between inflation and economic growth; Comparative experience of Italy and Austria. FIP-Finance and Law, 5(2), 91-101.
Swan, T. W. (1956). Economic growth and capital accumulation. Economic rRecord, 32(2), 334-361.
Thanh, S. D. (2015). Threshold effects of inflation on growth in the ASEAN-5 countries: A panel smooth transition regression approach. Journal of Economics, Finance and Administrative Science, 20(38), 41-48. Available at: https://doi.org/10.1016/j.jefas.2015.01.003 .
Tobin, J. (1965). Money and economic growth. Econometrica: Journal of the Econometric Society, 33(4), 671-684.
Appendix
| Variable | Coef. |
Std.Error |
t-Statistic |
Prob |
||
| C | -11.8434 |
3.6998 |
-3.2011 |
0.0036 |
R-squared |
0.6037 |
| Inflation | -0.2683 |
0.0796 |
-3.3752 |
0.0023 |
RSS |
885.3842 |
| SGCF | 1.5011 |
0.3081 |
4.8725 |
0.0000 |
||
Engle-Granger cointegration test |
||||||
Value |
Prob |
|||||
| Engle-Granger tau-statistic | -4.7043 |
0.0101 |
||||
| Engle-Granger z-statistic | -29.0142 |
0.0055 |
||||
| Inflation(π) | Variable | Coef. |
Std. Error |
t-Statistic |
Prob |
||
| C | 2.801625 |
2.667922 |
1.05 |
0.302 |
R-squared | 0.3608 |
|
| Inflation | 0.2750026 |
0.1497411 |
1.84 |
0.076 |
RSS | 1510.70629 |
|
| D(Infl-2) | -0.3470541 |
0.1666944 |
-2.08 |
0.045 |
|||
| π = 2 | GCFGrwth | -0.0076991 |
0.0235729 |
-0.33 |
0.746 |
||
| PopGrwth | 0.831895 |
1.115159 |
0.75 |
0.461 |
|||
| Lending rate | -0.000871 |
0.000283 |
-3.08 |
0.004 |
|||
| C | 2.803121 |
2.608098 |
1.07 |
0.291 |
R-squared | 0.3704 |
|
| Inflation | 0.2842688 |
0.1454527 |
1.95 |
0.059 |
RSS | 1487.82161 |
|
| D(Infl-3) | -0.3607 |
0.1630557 |
-2.21 |
0.034 |
|||
| π = 3 | GCFGrwth | -0.0077179 |
0.0233621 |
-0.33 |
0.743 |
||
| PopGrwth | 0.7293495 |
1.116001 |
0.65 |
0.518 |
|||
| Lending rate | -0.000881 |
0.0002812 |
-3.13 |
0.004 |
|||
| C | 2.712774 |
2.574602 |
1.05 |
0.3 |
R-squared | 0.3727 |
|
| Inflation | 0.2814514 |
0.1424347 |
1.98 |
0.057 |
RSS | 1482.56725 |
|
| D(Infl-4) | -0.3607844 |
0.1609577 |
-2.24 |
0.032 |
Adjusted R-squared | 0.2746 |
|
| π = 4 | GCFGrwth | -0.0071901 |
0.0232783 |
-0.31 |
0.759 |
||
| PopGrwth | 0.6650558 |
1.125076 |
0.59 |
0.559 |
|||
| Lending rate | -0.0008881 |
0.0002812 |
-3.16 |
0.003 |
|||
| C | 2.664078 |
2.566722 |
1.04 |
0.307 |
R-squared | 0.3721 |
|
| Inflation | 0.2779528 |
0.1413821 |
1.97 |
0.058 |
RSS | 1483.94352 |
|
| D(Infl-4.5) | -0.3585094 |
0.1604921 |
-2.23 |
0.033 |
|||
| π = 4.5 | GCFGrwth | -0.006843 |
0.0232681 |
-0.29 |
0.771 |
||
| PopGrwth | 0.6382081 |
1.132451 |
0.56 |
0.577 |
|||
| Lending rate | -0.0008913 |
0.0002816 |
-3.17 |
0.003 |
|||
| C | 2.62838 |
2.559695 |
1.03 |
0.312 |
R-squared | 0.3719 |
|
| Inflation | 0.2751838 |
0.1403306 |
1.96 |
0.059 |
RSS | 1484.38635 |
|
| D(Infl-5) | -0.3571285 |
0.160051 |
-2.23 |
0.033 |
|||
| π = 5 | GCFGrwth | -0.0064276 |
0.0232464 |
-0.28 |
0.784 |
||
| PopGrwth | 0.6066653 |
1.140114 |
0.53 |
0.598 |
|||
| Lending rate | -0.0008949 |
0.000282 |
-3.17 |
0.003 |
|||
| C | 2.549153 |
2.5456 |
1 |
0.324 |
R-squared | 0.3712 |
|
| Inflation | 0.2687869 |
0.1380799 |
1.95 |
0.06 |
RSS | 1485.97632 |
|
| D(Infl-6) | -0.353298 |
0.1589672 |
-2.22 |
0.033 |
|||
| π = 6 | GCFGrwth | -0.0055874 |
0.0232126 |
-0.24 |
0.811 |
||
| PopGrwth | 0.5485659 |
1.15549 |
0.47 |
0.638 |
|||
| Lending rate | -0.0009015 |
0.0002827 |
-3.19 |
0.003 |
|||
| C | 2.468822 |
2.541368 |
0.97 |
0.339 |
R-squared | 0.3686 |
|
| Inflation | 0.2601364 |
0.1363232 |
1.91 |
0.065 |
RSS | 1492.15387 |
|
| D(Infl-7) | -0.3467062 |
0.1584738 |
-2.19 |
0.036 |
|||
| π = 7 | GCFGrwth | -0.0050253 |
0.0232359 |
-0.22 |
0.83 |
||
| PopGrwth | 0.4988773 |
1.174808 |
0.42 |
0.674 |
|||
| Lending rate | -0.0009076 |
0.000284 |
-3.2 |
0.003 |
|||
| C | 2.367552 |
2.538246 |
0.93 |
0.358 |
R-squared | 0.3649 |
|
| Inflation | 0.2494867 |
0.1345228 |
1.85 |
0.073 |
RSS | 1501.00565 |
|
| D(Infl-8) | -0.3375855 |
0.1579252 |
-2.14 |
0.04 |
|||
| π = 8 | GCFGrwth | -0.0044745 |
0.0232832 |
-0.19 |
0.849 |
||
| PopGrwth | 0.4685892 |
1.193658 |
0.39 |
0.697 |
|||
| Lending rate | -0.0009033 |
0.0002847 |
-3.17 |
0.003 |
|||
| C | 2.238729 |
2.532224 |
0.88 |
0.383 |
R-squared | 0.3605 |
|
| Inflation | 0.2371249 |
0.1324177 |
1.79 |
0.083 |
RSS | 1511.41936 |
|
| D(Infl-9) | -0.3262028 |
0.15699 |
-2.08 |
0.046 |
|||
| π = 9 | GCFGrwth | -0.0038547 |
0.0233411 |
-0.17 |
0.87 |
||
| PopGrwth | 0.4631989 |
1.209106 |
0.38 |
0.704 |
|||
| Lending rate | -0.000894 |
0.0002851 |
-3.14 |
0.004 |
|||
| C | 2.094631 |
2.524279 |
0.83 |
0.413 |
R-squared | 0.3557 |
|
| Inflation | 0.2236911 |
0.1300176 |
1.72 |
0.095 |
RSS | 1522.63615 |
|
| D(Infl-10) | -0.3132408 |
0.1556515 |
-2.01 |
0.053 |
|||
| π = 10 | GCFGrwth | -0.003229 |
0.0234063 |
-0.14 |
0.891 |
||
| PopGrwth | 0.4748154 |
1.22196 |
0.39 |
0.7 |
|||
| Lending rate | -0.0008846 |
0.0002856 |
-3.1 |
0.004 |
|||
| C | 1.793292 |
2.583221 |
0.69 |
0.493 |
R-squared | 0.3328 |
|
| Inflation | 0.1794348 |
0.1288638 |
1.39 |
0.173 |
RSS | 1576.8568 |
|
| D(Infl-11) | -0.2617629 |
0.1561446 |
-1.68 |
0.103 |
|||
| π = 11 | GCFGrwth | -0.0023837 |
0.0238069 |
-0.1 |
0.921 |
||
| PopGrwth | 0.5804933 |
1.284568 |
0.45 |
0.654 |
|||
| Lending rate | -0.0008637 |
0.0002901 |
-2.98 |
0.006 |
|||
| C | 1.825183 |
2.510111 |
0.73 |
0.472 |
R-squared | 0.3466 |
|
| Inflation | 0.1977703 |
0.1251317 |
1.58 |
0.124 |
RSS | 1544.26086 |
|
| D(Infl-12) | -0.287682 |
0.1527905 |
-1.88 |
0.069 |
|||
| π = 12 | GCFGrwth | -0.0022174 |
0.0235422 |
-0.09 |
0.926 |
||
| PopGrwth | 0.5188602 |
1.242958 |
0.42 |
0.679 |
|||
| Lending rate | -0.0008676 |
0.0002866 |
-3.03 |
0.005 |
|||
| C | 1.694377 |
2.50012 |
0.68 |
0.503 |
R-squared | 0.3427 |
|
| Inflation | 0.1856579 |
0.1223936 |
1.52 |
0.139 |
RSS | 1553.49404 |
|
| D(Infl-13) | -0.275535 |
0.1509045 |
-1.83 |
0.077 |
|||
| π = 13 | GCFGrwth | -0.0018266 |
0.0236025 |
-0.08 |
0.939 |
||
| PopGrwth | 0.5513209 |
1.248566 |
0.44 |
0.662 |
|||
| Lending rate | -0.0008599 |
0.0002869 |
-3 |
0.005 |
|||
| C | 1.53635 |
2.487136 |
0.62 |
0.541 |
R-squared | 0.3381 |
|
| Inflation | 0.1723648 |
0.1195544 |
1.44 |
0.159 |
RSS | 1564.34316 |
|
| D(Infl-14) | -0.2615391 |
0.1488128 |
-1.76 |
0.088 |
|||
| π = 14 | GCFGrwth | -0.0014115 |
0.0236752 |
-0.06 |
0.953 |
||
| PopGrwth | 0.6141848 |
1.247386 |
0.49 |
0.626 |
|||
| Lending rate | -0.0008521 |
0.0002875 |
-2.96 |
0.006 |
Augmented Dickey-Fuller Unit Root Test |
||||||
| Variable | Test Statistic |
1% Critical Value |
5% Critical Value |
10% Critical Value |
Decision |
|
| GDPGrowth | Z(t) | -3.885 |
-3.668 |
-2.966 |
-2.616 |
I(0) |
| Inflation | Z(t) | -5.662 |
-3.668 |
-2.966 |
-2.616 |
I(0) |
| D(Infl-4) | Z(t) | -5.783 |
-3.668 |
-2.966 |
-2.616 |
I(0) |
| GCFGrwth | Z(t) | -5.982 |
-3.668 |
-2.966 |
-2.616 |
I(0) |
| GCF%GDP | Z(t) | -2.782 |
-3.621 |
-2.943 |
-2.610 |
I(0) |
| PopGrwth | Z(t) | -3.421 |
-4.297 |
-3.564 |
-3.218 |
I(0) |
| Lending rate | Z(t) | -5.922 |
-3.668 |
-2.966 |
-2.616 |
(0) |
Skewness/Kurtosis tests for Normality |
|||||
Joint |
|||||
| Variable | Obs |
Pr(Skewness) |
Pr(Kurtosis) |
adj chi2(2) |
Prob>chi2 |
| Residuals | 38 |
0.9051 |
0.1738 |
1.99 |
0.3695 |
| lags(p) | chi2 |
df |
Prob > chi2 |
| 1 | 2.157 |
1 |
0.1419 |
| Breusch-Pagan/Cook-Weisberg test | for heteroscedasticity |
||
| chi2(1) | 0.04 |
||
| Prob > chi2 | 0.8374 |
||
Footnotes:
3. Khan and Senhadji (2001) provide more information about the computations and the estimation procedure.
4. Stationary series or covariance stationary or weak stationary series have finite mean and variance, and the mean, variance and covariance are all constant.