Co-Integration Testing of the Relationship between Electricity Consumption and Investment in Senegal
Ebrima K. Ceesay1*
Momodou Mustapha Fanneh2
1,2School of Business and Public Administration Department of Economics University of the Gambia, Gambia |
AbstractThe study investigates the relationship between natural logarithm of electricity consumption and natural logarithm of investment (proxy gross capital formation in the short and long run ARDL model. The data was obtained from world Development Indicator (WDI). The Phillips-Perron test and ADF test were applied to test stationary of the data in the level and in trend in their first difference between electricity consumption and investment in Senegal. The ARDL model was applied. As the results generated, the trend is statistionary and the intercept is not stationary. The first difference of investment is not a statistically significant and negative sign, while the first difference in electricity consumption is significant and negative coefficient. In the long run, the natural logarithm of electricity consumption as the dependent variable and natural logarithm of investment as the independent variable are significant and positive. The future researchers could also apply co-integration testing when there is a structural break or break point in the data set and error correction model. |
Licensed: |
|
Keywords: |
|
Accepted: 3 May 2019 |
|
| (* Corresponding Author) |
Funding: This study received no specific financial support. |
Competing Interests: The authors declare that they have no competing interests. |
1. Introduction
Electricity and investment on it have improved so far global especially developed nation. In the developed nation as a source of electricity never goes off and businesses of any kind have lots of profit or return as electricity is the main sources of obtained profit in developed nations. The consistently increases in electricity consumption has more attract researcher to fill the gap between the demand and supply of electricity. Even Senegal had suffered a power shortage until the coming of the present government. Which made the electricity consumption to have expand to rural areas.
In Senegal, rural dwellers 38% have access to electricity supply, while in urban areas 88% of the peoples have access to the electricity supply. In average the overall electricity accessibility in Senegal is at 64% as of 2016.Compared to the world average stand at 31%. Senegal electricity supply was dependent on biomass. Senegal is an ECOWAS member state. The country, government is target to invest more on electricity by providing the rural at 90% and 100% for urban areas by 2025.
The purpose of the paper is to investigate the effect of investment (proxy by gross capital formation) on the electricity consumption level of Senegal. The study read investment- consumption nexus in many literature, some found negative, positive and some found a constant correlation between electricity consumption and investment. The paper also dealt with ADF, Phillips-Perron test, ARDL and ECM to ascertain short and long-run relationship between consumption and investment in Senegal. The paper question the nature of the relationship between investment and electricity consumption in developing countries. The idea behind this paper is the assumption in most case investment positively correlated with electricity consumption. The rest of the paper is organized as follows; section 2 literature reviews, section 3 Methodology, section 4 econometrics results and section 5 conclusion and recommendation.
| Time Series | 2010 |
2012 |
2014 |
2016 |
Access to electricity percent of total population:
|
53.% |
56.9% |
61% |
64.5% |
81% |
84.5% |
85% |
87.7% |
|
34.3% |
36.7% |
32.7% |
38.3% |
|
31.9% |
31.7% |
31.7% |
31.7% |
|
| Population, total | 13.0million |
13.8million |
14.7million |
15.4million |
| Renewable energy 1. Consumption(% of total energy consumption) |
50.35 |
50.4% |
43.3% |
- |
Renewable Electricity
|
||||
10.7% |
9.8% |
10.4% |
- |
|
198.5 |
209.6 |
221.6 |
- |
| Country Statistics sources: The World Bank. |
2. Literature
2.1. Theoretically Literature
Globally dependent on electricity has increased and consistently continued to rise in the level of consumption of electricity supply in most of the literature that wrote the link between electricity –investment, consumption and supply. There still a substantial gap between electricity consumption and its supplying most literature (Ubani, 2013).
In most countries in the developing world including Senegal suffered a major setback in the electricity industry and that lead to short-down most firm and business (Kumi, 2017; Ubani, 2013). In urban areas of Senegal, 88% have access to an electricity supply while only 38% of rural peoples access electricity supply. Investing in electricity consumption is a statistically significant role in economic growth, economic development and even increases wealth creation (Altinay & Karagol, 2005; Hatemi & Irandoust, 2005; Kasperowicz, 2014; Oh & Lee, 2004; Wolde-Rufael, 2006; Yoo, 2005). This lead to assume that there are several factors, such as investment, wealth creation to ensure a sufficient supply of electricity supply.
The peoples use electricity for any purposes such as freezing, cooking, heating, lighting, transformation, transportation, communication, security, internet and other functions.
2.2. Empirical Literature
The empirical finding in the correlation between electricity consumption as the dependent variables and gross capital formation as the independent variables are found in many works (Hubler, 2009; Mielnik & Goldemberg, 2002; Sadorsky, 2010; Tang, 2009).
The empirical the finding has mixed evidence, some found a positive correlation, others found negative and other found constant correlation between investment and electricity supply. For example, Tang (2009) in his Malaysia study, reported that investment positively affects electricity consumption. Sadorsky (2010) examined the long run effect of investment on electricity consumption for 22 developing countries and reported that investment positively influence electricity consumption. The findings of the study indicate a negative influence of investment on electricity consumption.
The studies reviewed used various estimation techniques such ARDL, ECM, Panel Data estimations, Granger causality testing, co-integrating testing to investigate the relationship between investment and electricity consumption.
2.3. Gap in the Literature
If there is s structural break either in the level, trend or regime, that can affect the relationship between investment and electricity supply in Senegal. The model can also suffer from omission variables bias. The co-integration test for stationary by using ARDL model, VECM does consider the issue of Granger causality analysis to the short and long-run effect of electricity consumption and investment in Senegal.
3. Methodology
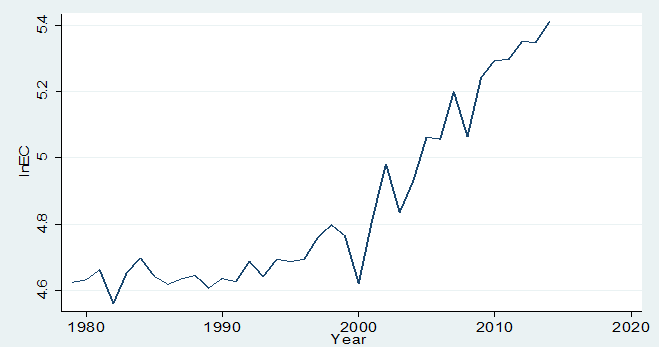
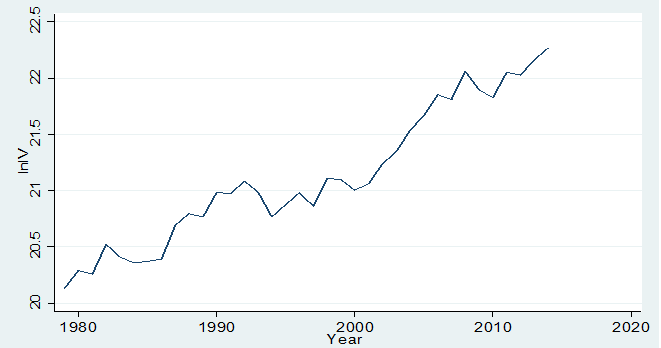
The study explores quantitative data from World development indicator to investigation the linkage between investment and electricity consumption in Senegal. The period covered is from 1979 to 2014.
3.1. Estimation Method
The data used was initially examined for stationary by employing the ADF and Phillip perror Unit root test for stationary. The null assumption of the ADF test is that the data set is stationary in their levels, whereas, the alternative assumption is that they are not stationary in their levels but in their first difference.The ADF test is first used and it is based on the null hypothesis that the variables under investigation are unit root in constants versus the alternative hypothesis that the variables in the model are not unit root in levels (Greene, 2002).
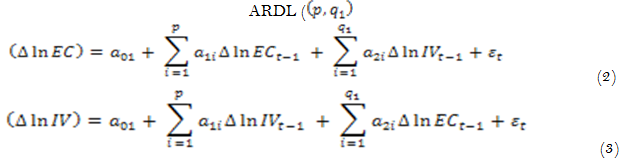
The study of long-run effect of investment on electricity consumption in Senegal was examined by employing the ARDL method of co-integration following the assessment of the stationarity properties of the data. The main advantage of the ARDL model is that, it can be used without knowing the stationarity properties of the data set if and only if they are integrated of order zero and one. In addition, it is robust in small sample studies (Hashem, Shin, & Smith, 2001; Pesaran & Shin, 1999).
3.2. Empirical Model![]()
Where:
![]() Natural logarithm of electricity consumption at time t
Natural logarithm of electricity consumption at time t
![]() : Is the natural logarithm of gross capital formation at time t (In which we take it as proxy for investment at time t)
: Is the natural logarithm of gross capital formation at time t (In which we take it as proxy for investment at time t)
Note: Electricity consumption is our dependent variable and investment is our regressor.
| Variables | Observation |
Mean |
Standard deviation |
| Electricity Consumption | 36 |
132.1416 |
38.9806 |
| Gross Capita Formation | 36 |
1.81e+09 |
1.17e+09 |
| Source: Author’s computation by sing stata 13 for window. |
Table 2 indicates descriptive statistics, there is 36 observation and we could notice that the means for electricity consumption is very high and the stand deviation from the mean was also very high. In that, the normal distribution curve will be approximately normal as the sample become large and the standard deviation increases.
| Variable | EC |
IV |
| EC | 1.00000 |
|
| IV | 0.9493 |
1.0000 |
| Source: Author’s Computation by Stata 13 for Window. |
The result in Table 3, indicated that there is a positive correlation between electricity consumption and investment in Senegal for the period under study. Which stand at 0.9493. There is, therefore perfect direct relationship between electricity consumption and investment in Senegal for the period under study.
4. Econometrics Results
We started to analysis this part by doing unit root test (ADF test and pperron test) and co-integration test (ARDL and ECM) to identify the relationship between investment (proxies gross capital formation) and electricity consumption in Senegal from 1979 to 2014.ARDL model was introduces by Hashem et al. (2001) to deal with the integration of order zero and integration of order one variables in the same estimates to see the co-integration process for the stationarity of the variables.
4.1. Unit Root Test Results
4.1.1. The ADF test
The Table 4, below indicated that the ADF test results for unit root test shown that both the trend and constant has positive slope and trend is stationary at 5%, while intercept is not stationary for the electricity consumption. The results further analysis that lag of electricity consumption has a negative sign, but not stationary in mean, variance and covariance, but also a negative coefficient for the lag of the first difference of electricity consumption. The results for the first difference is statistically significant at 5% with stationarity at the lag length of one.
| Variables | Coef. |
t-ratios |
ADF/P-value |
Results | Lag Length |
| Lag 1EC | -.083676 |
-0.80 |
0.433 |
Not stationary | 1 |
| LaEC(1st dif) | -.4379509 |
-2.60 |
0.014** |
Stationary | 1 |
| Trend | .7121934 |
1.93 |
0.063** |
Stationary | 1 |
| Constant | 2.673141 |
0.31 |
0.757 |
Not stationary | 1 |
| Source: Computed by Authors Using Stata/ for SE-64.exe 13 for Windows. ** p=0.05. |
The Table 5 below for the ADF test for the natural logarithm of investment on electricity consumption is very well established results which indicated that both in constant, trend, lag of the natural logarithm of investment are all stationary. The slope and constant have a a positive sign and while the slope of lag of the natural logarithm of investment in Senegal has a negative coefficient.
| Variables | Coef. |
t-ratios |
ADF/P-value |
Results | Lag Length |
| Lag 1In(IV) | -.331399 |
-2.46 |
0.020** |
stationary | 1 |
| Trend | .0192238 |
2.46 |
0.019** |
Stationary | 1 |
| Constant | 6.705781 |
2.48 |
0.019** |
stationary | 1 |
| Source: Computed by Authors Using Stata/ for SE-64.exe 13 for Windows. ** p=0.05. |
4.2. The Phillips-Perron Test for Unit Root
Phillips-Perron test for unit root is to modifying the ADF by correcting any serial correlation, heteroskedasticity in the error term and by been made robust to serial correlation, heteroskedasticity and autocorrelation consistent covariance matrix estimator. As the results generated all the coefficient and the intercept are positive slope and lag of electricity consumption is significant and the trend is also significant, while the intercept is not significant or not stationary.
| Variables | Coef. |
t-ratios |
ADF/P-value |
Results |
| Lag 1EC | .840868 |
8.09 |
0.000*** |
stationary |
| Trend | .7925521 |
2.16 |
0.038** |
Stationary |
| Constant | 9.816438 |
1.13 |
0.267 |
Not stationary |
| Source: Computed by Authors Using Stata/ for SE-64.exe 13 for Windows. ** p=0.05, *** p=0.01. |
When we are modifying the ADF test, we noticed that instead of all the variables are not stationary in mean, variance and covariance as the case of ADF test for investment in Senegal. In this case lag of investment is positive and stationary with any lag length. The trend is positive and not stationary, while the constant is negative and not stationary.
| Variables | Coef. |
t-ratios |
PP/P-value |
Results |
| Lag 1IV | .8885994 |
8.35 |
0.000*** |
stationary |
| Trend | 1.88e+07 |
1.68 |
0.103 |
NotStationary |
| Constant | -2.82e+07 |
-0.29 |
0.773 |
Not stationary |
| Source: Computed by Authors Using Stata/ for SE-64.exe 13 for Windows. *** p=0.01. |
Results for ARDL model/bound testing for co-integration of the relationship between electricity consumption and investment in Senegal. We started by lag selection criteria, which indicates that the maximum lags for the model were set at one.
The bound lags structure is that the natural logarithm of electricity consumption takes lags two and natural logarithm for investment takes lag zero. The outcome of the bound test of co-integration indicates that F-statistics which is 2.134 is clearly below I (0) bound of 4.04 and there is no co-integration when electricity consumption is the dependent variables. With DW test of (4, 33) =2.588, the model is affected by positive serial correlation. This is confirmed by Breusch-Godfrey LM test for autocorrelation prove that the p-value is rejected at 0.0282 and the model is suffering from serial correlation.
Further, heteroscedasticity test indicates that we do not reject homoscedasticity of equal variance because of the p-value of 0.2501. The results for cointegration bound testing indicates that the F-statistics below the I(0) and I(1), so there is no cointegration and we should follow the ARDL short run cointegration analysis.
| Dependent Variables | F-statistics |
Cointegration |
What is next? |
| InEC | F=2.134 T=-1.338 |
No |
ARDL(Short run) |
| InIV | F=0.710 T=-1.057 |
No |
ARDL(Short run) |
| Source: Computed by Authors Using Stata/ for SE-64.exe 13 for Windows. |
If there is no co-integration, we adopted the short run ARDL model and not the Error Correction Model for our analysis.
If there is co-integration in the long run, we applied the long run co-integration technique called error correction model as follows:
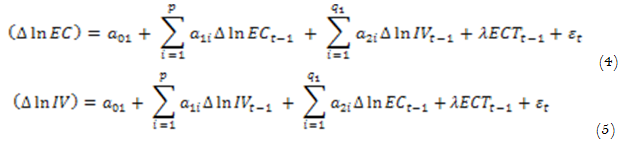
Where:
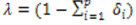 , speed of adjustment with a negative sign.
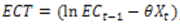 , the error correction term is the extracted residuals from the regression of the long-run equation
 , is the long-run parameter
![]()
Long run coefficient indicated that investment has a positive coefficient and statistically significant determining the electricity consumption in Senegal in the long run.
| Variables | Coefficients |
Std Error |
T-Statistics |
P-Value |
| Constants | -1.371261 |
.6793114 |
-2.02 |
0.053** |
| InIV | .5692687 |
.1869441 |
3.05 |
0.005** |
| Source: Computed by Authors Using Stata/ for SE-64.exe 13 for Windows. ** p=0.05. |
The table below as we made the Natural logarithm of investment as our dependent variable, the sign for electricity was also positive and statistically determinant of investment. Meaning investment rises by 1% in the long run, electricity consumption increases by approximately 400.
| Variables | Coefficients |
Std Error |
T-Statistics |
P-Value |
| Constants | -1.371261 |
.6793114 |
-2.02 |
0.053** |
| InEC | 2.398419 |
.8735748 |
2.75 |
0.010** |
| Source: Computed by Authors Using Stata/ for SE-64.exe 13 for Windows. ** p=0.05. Estimated ARDL Short run coefficients when the dependent variable is InIV. |
We can see that hence the model indicated that the short run ARDL model is more appropriate, because of no-cointegration between variables under discussion. The first difference of investment is not significant and associated with a negative sign. In the short investment is negatively correlated with lag of investment. The constant is a positive sign and not significant as well.
| Variables | Coefficients |
Std Error |
T-Statistics |
P-Value |
| Constants | 1.14731 |
1.310291 |
0.88 |
0.388 |
| lnIV_1 | -.195897 |
.1775108 |
-1.10 |
0.279 |
| N= 34 R-squad = 0.0959 |
||||
| Source: Computed by Authors Using Stata/ for SE-64.exe 13 for Windows. |
When we take electricity consumption as our dependent variables, we could notice some changes. Electricity at first difference is also negatively related to electricity consumption in the short run but is statistically significant. The coefficient is negative but significant as well. The results are suffering from serial correction, autocorrelation and heteroscedasticity.
| Variables | Coefficients |
Std Error |
T-Statistics |
P-Value |
| Constants | -1.371261 |
.6793114 |
-2.02 |
0.053** |
| lnEC_1 | -.3272962 |
.1752388 |
-1.87 |
0.072** |
| Number = 34 R-sq. = 0.2344 |
||||
| Source: Computed by Authors Using Stata/ for SE-64.exe 13 for Windows. ** p=0.05. |
4.3. Overall Results for Short and Long Run Analysis for the Relationship between N Electricity Consumption and Investment in Senegal
The results of short-run ARDL model with intercept and error correction are reported above. The short-run coefficient in trend and constant are negative and positive sign respectively. The short run is not statistically significant and the long run statistically significant and positive sign. The natural logarithm of electricity consumption in Senegal is statistically significant in the long run and not statistically significant in the short run ARDL mode with error correction.
Furthermore, the results for the long run ARDL model when the dependent variables are InEC in senegal. The results indicates that investment is statistically determine the electricity consumption in Senegal with a positive sign. It means that investment rises with electricity consumption and it has a priori hypothesis. This means in the long run one percent increases in investment, electricity consumption will rises by 5.69 percentage.
5. Conclusion and Recommendation
The co-integration testing failed and we adopted the short-run ARDL model to see the linkages between change in the natural logarithm of electricity consumption and the natural logarithm of investment in the short run. As a result, generated, trend and constant have negative and positive slope respectively.
In the short run, the natural logarithm of electricity consumption on investment is not statistically significant in the short run ARDL model. In the long run ARDL model, investment is statistically and positive sign. One percent increase in investment increases electricity consumption by 5.69%.
The recommendation for the policymakers should also try to also deal with multivariate analysis, Granger causality analysis and also counts on the structural break that may have happened in Senegal with Casamance conflict under study.
References
Altinay, G., & Karagol, E. (2005). Electricity consumption and economic growth: Evidence from Turkey. Energy Economics, 27(6), 849-856.
Greene, W. (2002). Time series models. P. 608-662 in econometric analysis (5th ed.). Upper Saddle River, NJ: Prentice Hall.
Hashem, M. P., Shin, Y., & Smith, R. J. (2001). Bounds testing approaches to the analysis of level relationships. Journal of Applied Econometrics, 16(3), 289-326.
Hatemi, A., & Irandoust, M. (2005). Energy consumption and economic growth in Sweden: A leveraged bootstrap approach, 1965–2000. International Journal of Applied Econometrics and Quantitative Studies, 2(4), 87-98.
Hubler, M. (2009). Energy saving technology diffusion via FDI and trade: A CGE model of China, working papers No.1479, Kiel institute for the world economy. International Journal of Energy Economics and Policy, 5(1), 138-147.
Kasperowicz, R. (2014). Electricity consumption and economic growth: Evidence from Poland. Journal of International Studies, 7(1), 46-57.
Kumi, T. (2017). The electricity situation in Ghana: Challenges and opportunities. CGD policy paper. Washington, DC: Center for Global Development. Retrieved from https://www.cgdev.org/publication/electricity-situation- ghana-challenges-and-opportunities. .
Mielnik, O., & Goldemberg, J. (2002). Foreign direct investment and decoupling between energy and gross domestic product in developing countries. Energy Policy, 30(2), 87-89.
Oh, W., & Lee, K. (2004). Energy consumption and economic growth in Korea: Testing the causality relation.
Pesaran, M., & Shin, Y. (1999). An autoregressive distributed lag modelling approach to cointegrated analysis. In: Strom, S. (Ed.), econometrics and economic theory in the 20th century: The Ragnar Frisch Centennial Symposium. Cambridge, MA: Cambridge University Press.
Sadorsky, P. (2010). The impact of financial development on energy consumption in emerging economies.
Tang, C. F. (2009). Electricity consumption, income, foreign direct investment, and population in Malaysia: New evidence from multivariate framework analysis. Journal of Economic Studies, 36(4), 371-382.
Ubani, O. (2013). Determinants of the dynamics of electricity consumption in Nigeria. OPEC Energy Review, 37(2), 149-161.
Wolde-Rufael, Y. (2006). Electricity consumption and economic growth: A Time series experience for 17 African countries. Energy Policy, 34(10), 1106-1114.
Yoo, S. H. (2005). Electricity consumption and economic growth: Evidence from Korea. Energy Policy, 33(12), 1627-1632.
| Country | Y |
Gross fixed capital formation |
Electricity consumption |
| Senegal | 1979 |
556107019.7 |
102.0537397 |
| Senegal | 1980 |
649113923.4 |
102.8135877 |
| Senegal | 1981 |
630294908.1 |
105.906818 |
| Senegal | 1982 |
819482583.2 |
95.7760725 |
| Senegal | 1983 |
734177385.9 |
105.2373619 |
| Senegal | 1984 |
695342252.9 |
109.7096716 |
| Senegal | 1985 |
705780497.2 |
103.9363502 |
| Senegal | 1986 |
719373352 |
101.4035113 |
| Senegal | 1987 |
971149304.9 |
103.1347151 |
| Senegal | 1988 |
1074783455 |
104.2490858 |
| Senegal | 1989 |
1046999212 |
100.2920067 |
| Senegal | 1990 |
1302201722 |
103.2344546 |
| Senegal | 1991 |
1286402114 |
102.1868368 |
| Senegal | 1992 |
1436247866 |
108.7210334 |
| Senegal | 1993 |
1305884887 |
103.8421599 |
| Senegal | 1994 |
1046381705 |
109.3727771 |
| Senegal | 1995 |
1169090445 |
108.6135582 |
| Senegal | 1996 |
1298503520 |
109.3148632 |
| Senegal | 1997 |
1153106262 |
116.6744667 |
| Senegal | 1998 |
1472377036 |
121.2521074 |
| Senegal | 1999 |
1456921537 |
117.3548669 |
| Senegal | 2000 |
1326713193 |
101.6789471 |
| Senegal | 2001 |
1403234680 |
123.3410992 |
| Senegal | 2002 |
1675947136 |
145.7170583 |
| Senegal | 2003 |
1867989138 |
125.9489513 |
| Senegal | 2004 |
2262355443 |
138.4636504 |
| Senegal | 2005 |
2571371490 |
157.9377823 |
| Senegal | 2006 |
3098366548 |
157.1374268 |
| Senegal | 2007 |
2973482674 |
181.1588558 |
| Senegal | 2008 |
3827382585 |
158.309309 |
| Senegal | 2009 |
3234323647 |
189.0698504 |
| Senegal | 2010 |
3017680748 |
199.1293279 |
| Senegal | 2011 |
3779360021 |
199.6855854 |
| Senegal | 2012 |
3694980518 |
210.7488788 |
| Senegal | 2013 |
4234767860 |
210.1935367 |
| Senegal | 2014 |
4684669761 |
223.4961633 |
| Source: WDI 2017. |
Appendix