Modeling for Stock Price Forecasting in Colombo Stock Exchange: An Historical Analysis of Stock Prices
Liyanagamage C.1*
Madusanka P.H.A.C.2
1Senior Lecturer, The Open University of Sri Lanka. |
AbstractStock prediction with data mining techniques is one of the interesting areas being investigated in recent research. Weighted Moving Average (WMA) technique is one such widely used technique in stock forecasting, in which each historical data term can have its own weightage. One of the main drawbacks of WMA is that there is no exact base to determine those weighting factors. Because of this drawback, the investors can assign arbitrary weightages on periodical data though it is misleading the investment decisions. The present study addresses the limitations in Weighted Moving Average technique and tries to generate more reliable and statistically proven weighting factors for stock price prediction. We develop a more reliable stock predictive model by using a panel data set of quarterly closing stock prices of 41 companies for a period of ten years, approximating a sample size of 1680 observations. The Auto Regressive Moving Average model analysed in our study provides strong evidence for statistically significant impact of past stock prices on current stock prices. The study further found statistically more reliable weight factors for past four quarters which can be used for forecasting future stock prices. The findings of the present study confirm that the weight factor drops as the data become older in a linear pattern. |
Licensed: |
|
Keywords: JEL Classification: |
|
Received: 16 November 2020 |
|
| (* Corresponding Author) |
Funding: This study received no specific financial support. |
Competing Interests: The authors declare that they have no competing interests. |
1. Introduction
Successful stock price forecasting could yield significant profit. But it is believed that stock prices have a random walk and are unpredictable in nature. Number of researches has been conducted to predict the stock market performances utilizing various statistical approaches. These were ended up with different results but could not provide effective, reliable and deeper analysis on forecasting stock prices. Weighted Moving Average is a technique which has widely been used to predict stock prices based on past time series data. Later developments to this technique can be seen in recent applications of forecasting. One such development is Exponential Moving Average (EMA). Basically, Exponential Moving Average is a modification of Weighted Moving Average technique which gives higher weighting factors on more recent data. This characteristic cannot be seen in Simple Moving Average method (Hansun, 2013).
The stock markets are characterized with non-linear moving pattern due to the complexity and highly volatile nature of these markets. The present study expects to develop a predictive model with the aim of providing more reliable and precise forecasting results on stock prices. Weighted moving average technique has gained a high level of acceptance by researchers as a data mining and forecasting technique due to its adaptability advantages and high level of elasticity. Weighted Moving Average technique facilitates analysis of a larger data set which is highly volatile in nature. This Technique had been utilized extensively in the fields of banking, engineering, and medical sciences, other than the typical discipline areas of business, economics and finance.
Further, according to the Weighted Moving Average technique, each historical data term can have its own weightage and the summation of those weightages may be equal to one or may not be equal to one. For an example, in the three term Moving Average Model, the most recent data might be assigned the weight value of 0.5 and second most recent period data might be assigned a weighting factor of 0.3 and then third most recent data with a weighting of 0.2. The main concern of Weighted Moving Average technique is to give more weight on most recent data. However, there is no exact base to determine those weighting factors. Because of this drawback, the investors can assign arbitrary weightages on periodical data though it is misleading the investment decisions.
Hence, we identified the need of developing a forecasting model to provide more reliable information for the investors who seek speculative gains through stock market transactions. Further, according to the best of the knowledge of the researcher, there had been no studies focus on generating more reliable weighting factors for the WMA Model despite assigning random weights on periodical data terms. By using historical share prices, the present study tries to develop a model to predict future share prices for companies listed in Colombo stock exchange. Hence, we try to find out more reliable weighting factors to assign to those periodical data terms. More specifically, we first test if the previous stock prices have statistically significant impact on current /future stock prices. And then, we estimate for more accurate weightages of past stock prices to predict future stock prices.
2. Literature Review
Moving average technique is a kind of data analysis model which uses a periodic data set with variations and forecasts another new and smooth data set with less variation. This model is used when the selected sample set of data does not provide any hint of seasonal pattern or a trend. In the Weighted Moving Average Model; every historical data is given a particular weighting from a weighting group of a univariate forecasting profile. This Weighting Moving Average technique allows the analyzer to weight the most recent data more heavily as recent data are more representative than older data. Therefore, this model provides more accurate forecasting results as it can quickly respond to the change levels.
A variety of different versions are available to moving average in technical analysis. Simple Moving Average (SMA) is the most primary moving average technique which calculates an average closing price for a particular period.
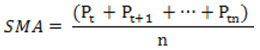
Where:
P = Price.
n = Number of periods.
The key limitation of SMA technique is that data is not given proper weighting based on the time differences. Because of that drawback of SMA, a Weighted Moving Average technique has been introduced.
The general formula for this model is…,
Linearly Weighted Moving Average is another version of moving average calculation which gives highest weights for more recent data than old ones. The weight factor drops as the data become older in a linear pattern. The highest weight is assigned to the most recent period and then the weight is going in a descending order based on the number of the periods being used. Therefore, Linearly Weighted Moving Average technique more quickly responds to the changes in the data set than the Simple Moving Average (SMA) and Exponential Moving Average (EMA).
The Formula for Linearly Weighted Moving Average can be stated as follows…,
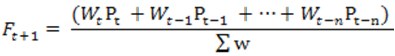
Where:
P = Price for the period.
t = the most recent period.
t- 1 =the prior period.
W = the assigned weight.
Accuracy of the moving average models mostly depends on the decisions of weighting factor. The summation of weighting factors has not to be 100%. When in such a scenario of total weight is not added up to 100%; the total of weighted historical data figure should be divided by the total weighting factor. This is similar to Linearly Weighted Moving Average formula which is already mentioned above.
One of another moving average model used in stock price predicting is, Exponentially Moving Average model, which also gives higher significance to more recent data than the Simple Moving average model which weights all the data similarly. Therefore, Exponential Moving Average model reacts quickly to recent price changes more than Simple moving average technique. However, unlike the Linearly Weighted Moving Average technique in this model, the decrease between one price and its preceding price is not consistent. The difference in the decrease is exponential.
The formula for Exponential Moving Average model can be explained as follows..,
Where:
P = Price.
t = Today.
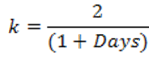
SMA=Simple Moving Average for the period.
y = Prior day.
However, there are some inherited limitations in all the Weighted Moving Average Techniques. One of them is having recency biasness. Most investors believe that most recent data better reflect price trends while others believe that privileging particular dates other than develop biasness in the trend analysis. Furthermore, these models heavily rely on historical data while investors insist that all the available company information is shown in current market prices as markets are efficient. If the markets are indeed efficient; analyzing historical data might give nothing new. Both the EMA and WMA techniques have similar calculation formulas which gives more importance to most recent data than the older data. Hence, these two models are better than the SMA model for trend analysis purposes.
A financial market is a dynamic and complex system which is attributed with evolutionary and non-linear nature. Therefore, the forecasting related to financial markets are always associated with noise, non-stationary, noise, hidden patterns and unstructured nature. Because of these characteristics of financial markets, it is very difficult to carry out a forecasting. Even though the Efficient Market Hypothesis suggests a random walk existing in stock markets, it has no further validated as per the evolutionary research findings. According to those findings the stock price movements are affected with political environment, business environment, global crisis and natural disasters (Irshad, 2017; Njiforti, 2015).
However, previous research studies of prediction on stock prices have ignored the impact of fundamental analysis while giving more weight predominantly on the variables of technical analysis. However, the core assumption in technical analysis is that all available and known fundamental factors are intrinsic into stock prices. Before the advent of computers, they used to do trading based on intuition. Then the searching for more advanced tools to predict stock movements was increased due to the continuous growth of investment and trading activities. Then, gradually more accurate techniques of time series analysis, linear regression, Chaos theory statistical approaches, technical and fundamental analysis were found in order to minimize risk and losses while accurately predicting stock movements directions.
Evidence shows that there are several studies which had been conducted to examine the effectiveness of Neural Network models in stock market forecasting. According to them most of the research studies on prediction of stock market movements have used the technique of Weighted Moving Average. And there are two main schools of thoughts on stock movement prediction as “Computer experiments in virtual markets” and “Real life financial data analyses”. A study conducted by Yoda (1994) investigated the predictive capacity of the neural network models for the Tokyo Stock Exchange. Also, Wong, Wang, Goh, and Quck (1992) used neural network models to forecast stock market returns in United States. Kryzanowski, Galler, and Wright (1993) used neural network models to choose the best stock to invest among Canadian companies.
According to Efficient Market Hypotheses, share prices indicates all the available information in the market, hence investors can’t forecast share prices. However, there is large number of previous literature to prove that share prices can be forecasted up to a certain level. For an example; Brock, Lakonishok, and LeBaron (1992) examined the predictability of “Dow Jones Industrial Average Index” by applying two different techniques of “Moving Averages” and “Trading-range breaks” and they could generate buy and sell signals using the said two trading rules. The results of their study provide a great support for the technical analyses. These findings suggest that there is a significant level of inefficiencies in the markets and therefore, the predictability of stock movements is viable.
To predict the market movements, fundamental, technical and statistical analyses have been used until now and none of them has declared as a tool of consistently accurate forecasting. The weighted Moving Average techniques allow trends to be more visible by averaging the stock prices of a considering period. The Moving average technique generates buy and sell signals, but unfortunately those signals may be misleading as the technique of Weighted Moving Average is based on past data estimation. Therefore, a technical trader will miss a significant number of signals of stock movements. Since moving average is a past estimate, a technical trader can often miss a lot of the potential in the stock movement before the appropriate trading signal is generated. Hence merely depending on technical analysis is not recommended in forecasting of future stock price Movements (Lawrence & Wang, 1997).
Stock price prediction has always been one of the most challenging tasks faced by researchers and financial analysts. This is mainly due to the high fluctuations and irregularity in stock markets. Hence, for many years understanding the signals for buying or selling financial assets had been an interest of study. As a result, by using publicly available data, quantitative models have been extensively used to analyze the statistical patterns in financial data sets. ARCH or GARCH models are such techniques are the mostly applied in financial forecasting. This is due to their ability to forecast volatility, and allow for heteroskedasticity and volatility clustering. Autoregressive model was first introduced by Engle (1982) with his ARCH model in order to capture the conditional variance of a given time series. However, extensions to the original ARCH model were developed later due to the limitations found in it such as including the choice of lags in the squared errors and non-negativity constraint (e.g (Bollerslev, 1986; Nelson, 1991)).
Auto Regressive Moving Average (ARMA) and Auto Regressive integrated Moving Average (ARIMA) models have also been popular in stock price prediction. ARIMA models are known to be robust and efficient in financial time series forecasting especially short-term prediction than even the most popular ANNs techniques (Kyungjoo, Sehwan, & John, 2007). By using published stock data obtained from New York Stock Exchange and Nigeria Stock Exchange (Adebiyi, Adewumi, & Ayo, 2014) tested ARIMA model for stock prediction. Their results revealed that the ARIMA model has a strong potential for short-term prediction and can compete favourably with existing techniques for stock price prediction.
In conclusion, there is no model to be recommended as the right one. There is no right and best model for prediction of stock movements. Each and every model has its own benefits and limitations as the market is a kind of chaotic system where it is in predictable nature at sometimes while in other times it totally behaves in a way of random nature. Therefore, it can be concluded as it is best to employ several models and techniques (Technical, fundamental and statistical) together to generate more accurate predictions.
3. Data and Methodology
In the Moving Average model, the output variable linearly depends on the present and past data values of imperfectly predictable term. In this study, current and past closing stock price data are used to predict the trends of stock price movements. Hence, conceptually the predictive model is a linear regression of current value of the series against current and previous noise error terms and random shocks.
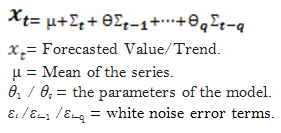
From the above-mentioned relationship, the authors develop a model specific to this study as follows.,
By taking into consideration the fact of random shocks and errors, the above regression equation can be further developed as…,
Where,
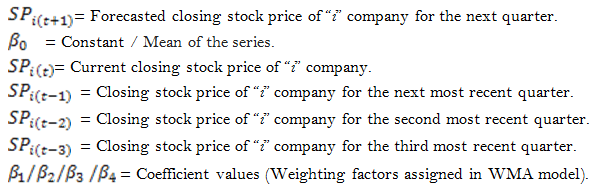
To run the above model, we used most recent quarterly closing prices of companies as the dependent variable.Then as the independent variables, we considered the most recent four quarter periods’ quarterly closing share prices of the sample companies. ![]() value indicates the constant of the equation while other beta values works as the coefficient of each periodic term which means the impact ratio of those quarters to the predicting quarter.
value indicates the constant of the equation while other beta values works as the coefficient of each periodic term which means the impact ratio of those quarters to the predicting quarter.
We used purposive sampling as the sampling method. The top four companies which has highest last trading stock price from each industry sector covering almost all the sectors in CSE have been selected for the sample. Though there are twenty sector catogories in Colombo Stock Exchange, several sectors have been merged in to one catogary while skipping some other sectors which were insignificant for analysis purpose. This procedure resulted a sample size in to 41 companies. The sample period coveres quarterly closing prices of 10 years comencing from 2009 first quarter to 2019 second quarter. The daily share prices of each company were collected from 1st January 2009 to 31st June 2019. Then average quarterly share prices were derived from the daily share prices were used for the analysis. Finally, the sample size was concluded as approximately 1680 observations. The main source of data collection was Colombo Stock Exchange Data Library.
The Weighted Moving Average Model was slightly developed in this study by adding a constant factor to the formula. The Auto Regressive Moving Average (ARMA) model used in this study was analysed by using E-views statistical package.
4. Results and Discussion
4.1. Stationary Test
A Unit Root test was carried out to check whether a time series past stock price data is non- stationery or having a unit root. The Null hypothesis of this kind of unit root tests is the presence of unit root while the alternative hypothesis is stationarity. As the purpose of the researcher is to develop a predicting model, an ADF (Augmented Dicky Fuller) unit root test was carried out in order to test the stationarity. According to the results of ADF, the probability value was less than 5%. This means the null hypotheses of having a unit root can be rejected. The time series can be stated as stationary which supports for prediction ability of the series. And further the output t-statistic also indicates a higher negative value supporting stronger evidence for rejecting null hypotheses of unit root existence.
4.2. Main Findings
For the purpose of estimating more reliable weightages for the predicting model, the Equation 2 was estimated as cross section weights, panel regression analysis which was corrected for the presence of cross-section heteroskedasticity. The stock price of present quarter SPt was regressed with stock price of first most recent quarter SP(t-1), stock price of second most recent quarter SP(t-2), stock price of third most recent quarter SP(t-3) and finally stock price of fourth most recent quarter SP(t-4).
Interestingly, coefficients in relation to stock prices of all the recent quarters found to be statistically significant at 99% level of confidence, denoting the predictability power of historical stock price data for future stock prices. The summary result of the estimated ARMA model is presented in Table 1.
| Variable | Coefficient |
| CONSTANT SP(t-1) SP(t-2) SP(t-3) SP(t-4) | 24.0565**
(1.75) 1.1090***
(45.30) - 0.3704***
(-10.29) 0.2755***
(7.66) - 0.0659*** (-2.69) |
| Adjusted R-squared F Stat DW Stat Number of observations |
0.90 3810*** 2.01 1666 (after adjustment) |
| Notes: t values for coefficient are in parentheses. *** and ** indicate a significant difference from zero at 1%, and 5%, respectively. |
According to the results of the ARMA model presented above, the stock price of most recent quarter shows a significant positive impact on the stock price of the present quarter with the coefficient value 1.109. This relationship suggests, if a stock price of most recent quarter is Rs.100, then the present quarter price of that stock is approximately Rs. 110.90. This result provides evidence of having a positive impact of most recent stock prices on present stock prices. However, according to the results of regression output, the second most recent quarter has a negative impact on the current stock price. The found coefficient was -0.37 and statistically significant at 99% level of confidence. This says that the present price of a stock is approximately Rs.37 less than its price of most second recent quarter.
Once again, the price of a stock in third most recent quarter has a positive impact on the present price of the same stock. The found coefficient was 0.28 and significant at 99%level of confidence. This finding says present quarter price of every stock is 28% higher than that of third most recent quarter. Most interestingly the fourth most recent quarter again shows a negative impact on the stock price of the present quarter however was not much strong and stood at -0.07. This indicates that the impact of the stock price of fourth most recent quarter on its present quarter price is a decline in seven cents. The constant value of the regression model of stock price prediction is Rs.24.06, which explains the impact on present stock prices due to unobserved factors.
As the study incorporated only four quarters for predictive modeling, the Equation 2 can be presented as follows.
![]()
The findings of the predictive model estimated in this study support the literature which highlights the predictable power of historical data in forecasting future stock prices. Similarly, the findings support assigning highest weights for more recent data than old ones. The findings of the present study reveal that the weight factor drops as the data become older in a linear pattern. The highest weight can be assigned to the most recent period and then the weight is going in a descending order based on the number of periods being used. Accordingly, the particular weights found in this analysis was 1.1, -0.37, 0.28 and -0.07 for the first most recent quarter to fourth most recent quarter respectively.
The look back period of the predictive model; in other words, the time frame or length one choose for a moving average, can play a big role in deciding how effective the model is. In our estimation we used only four recent quarters. Choosing four quarters has also made the model effective as the weights are proved a diminishing pattern and a weak predictive power could be observed after third quarter.
4.3. Robustness of the Model
The estimation procedures of the predictive model were generated heteroscedasticy consistent estimates by employing White’s correction in order to keep the estimators efficient. The last rows in Table 1 give more information on how the explanatory power of historical stock price data has been built up. The adjusted R-squared value says that the predictive model used by the study generally explains around 90% of variations in stock prices in Colombo Stock Exchange. The constant values of the predictive model are comparatively high in the present study. These comparatively higher constant may explains a rather unpredictable pattern of stock price behavior in Sri Lankan stock market. Especially the frequent stagnation of measurable and non-measurable economic activities and different responses of stock prices for these variations have dramatically affected in relating the outcomes of findings of this kind of studies to the actual data. The stability model tested here is free from autocorrelation as the DW stat of the model is within the decision range.
5. Conclusion
The main objective of this study was to develop a model to predict future share prices for companies listed in Colombo stock exchange. For this purpose, impact of historical stock prices on predicting current stock prices was analyzed. The ARMA model tested in this study concluded that there is a relationship between past stock prices and current stock prices while recent stock prices have bigger impact on current stock prices. Also, the analysis could generate more reliable weighting factors by addressing the drawback of Weighting Moving Average Technique which uses mere arbitrary values as weightages to weight periodical data terms. The experimental results obtained in this paper with ARMA model revealed the potential of ARIMA models to predict stock prices satisfactory on short-term basis. This could guide investors to thoroughly analyze the past stock price movements when entering in to investments decisions as there is a strong impact of past stock prices on current stock prices, specially, when the data are more recent. Forecast accuracy of our model will be high due to the fact that the series are highly correlated to the immediate past stock price. This particular stock price behavior can be made use for prediction and investment decisions.
Therefore, based on statistically proven result of the analysis, we can recommend the predictive model developed in this study to forecast stock prices of Colombo Stock exchange in order to gain speculative earnings. Due to the practical limitations, the present study could only present a general predictive model of forecasting for all the companies which are under different industry sectors. Therefore, it is suggestive to incorporate all the companies under each and every industry classification to the analysis in order to generate industry specific stock price predictive models which are highly significant and accurate on statistical standards.References
Adebiyi, A. A., Adewumi, A. O., & Ayo, C. K. (2014). Stock price prediction using the ARIMA model. Paper presented at the UKSim-AMSS 16th International Conference on Computer Modelling and Simulation.
Bollerslev, T. (1986). Generalized auto regressive conditional heteroskedasticity. Journal of Econometrics, 31(3), 307-327.
Brock, W., Lakonishok, J., & LeBaron, B. (1992). Simple technical trading rules and the stochastic properties of stock returns. The Journal of Finance, 47(5), 1731-1764.
Engle, R. F. (1982). Autoregressive conditional heteroscedasticity with estimates of the variance of United Kingdom inflation. Econometrica, 50(4), 987-1007.
Hansun, S. (2013). A new approach of moving average method in time series analysis. Paper presented at the Conference on New Media Technology, Tangerang, Indonesia.
Irshad, H. (2017). Relationship among political instability, stock market returns and stock market volatility. Studies in Business and Economics, 12(2), 70-99.
Kryzanowski, L., Galler, M., & Wright, D. W. (1993). Using artificial neural networks to pick stocks. Financial Analysts Journal, 49(4), 21-27.
Kyungjoo, L. C., Sehwan, Y., & John, J. (2007). Neural network model vs. SARIMA model In forecasting Korean stock price index (KOSPI). Issues in Information System, 8(2), 372-378.
Lawrence, R. W., & Wang, Y. (1997). Determination of neutralization potential in the prediction of acid rock drainage. Paper presented at the Proceedings of 4th International Conference on Acid Rock Drainage, Vancouver.
Nelson, D. B. (1991). Conditional heteroskedasticity in asset returns: A new approach. Econometrica, 59(2), 347-370.
Njiforti, P. (2015). Impact of the 2007/2008 global financial crisis on the stock market in Nigeria. CBN Journal of Applied Statistics, 6(1), 49-68.
Wong, F. S., Wang, P. Z., Goh, T. H., & Quck, B. K. (1992). Fuzzy neural systems for stock selection. Financial Analysis Journal, 48(1), 47-52.
Yoda, M. (1994). Predicting the Tokyo stock market. In G.J. Deboeck (Ed.), Trading on the Edge: Neural, Genetic, and Fuzzy Systems for Chaotic Financial Markets (pp. 66-79). New York: Wiley.