Economic Growth, Corruption, and Financial Development: Evidence from Ukraine
Klaus Ziernhold1*
Liubov Jung-Ivannikova2
1,2University of Bradford, UK. |
AbstractThis study was aimed to determine the long-run as well as the short-run impact of economic growth on the financial development of Ukraine during the period of study 1996-2019. The outcome variable of the study was financial development and the independent variables include economic growth as well as corruption. The data was obtained from the official website of world development indicators as well as from the world’ bank's official website for this purpose. The findings of ARDL estimations using error-corrected versions proved that economic growth and corruption strongly influencing the financial development of Ukraine during the period of study 1996-2019. The economic growth proved to be positive while the corruption proved to be negatively influencing the financial development of Ukraine during the period of study. It is inferred from the findings of this study that the financial development of Ukraine during 1996-2019 is strongly boosted by economic growth while the same is strongly declined by corruption in the long term as well as in the short term. The policymakers in Ukraine should carefully take steps to enhance their per capita real GDP to enhance financial development. However, they need to take some series of steps to control their increasing trend of corruption, as it will harm their level of financial development. The study is generable to other countries in comparative mode with lower-middle-income level category only. Future studies may include some more indicators of corruption as well and economic growth that may influence financial development. |
Licensed: |
|
Keywords: JEL Classification |
|
Received: 22 February 2021 |
|
| (* Corresponding Author) |
Funding: This study received no specific financial support. |
Competing Interests: The authors declare that they have no competing interests. |
1. Introduction
1.1. Research Background
The modern economy is not unfamiliar with corruption (Yudhvir & Sunita, 2012). Mostly every country has evidence to support that claim. It is no indisputable fact that it may be found at all phases of economic growth, in diverse shapes and levels, because in all sorts of political regimes. Because reliable data about corruption was lacking most in the early days, scholars had to depend extensively on findings from particular instance research in general nations, making it impossible to determine the precise amount with which corruption impacts other factors. Analysts are mostly worried about corruption's influence as well as strategy affecting growth in the economy. There's much research in academia that focuses on the impact of corruption as well as financial development upon growth in the economy, however, there is little research evidence on the relationship between financial development and corruption. Especially, in the case of Ukraine, no such evidence was supported by the past literature. There is a need to assess the financial development of Ukraine based on its economic growth and corruption index. Figures 1-3 are the line charts that elaborate on the country’s financial development, economic growth, and corruption trends during the past years.
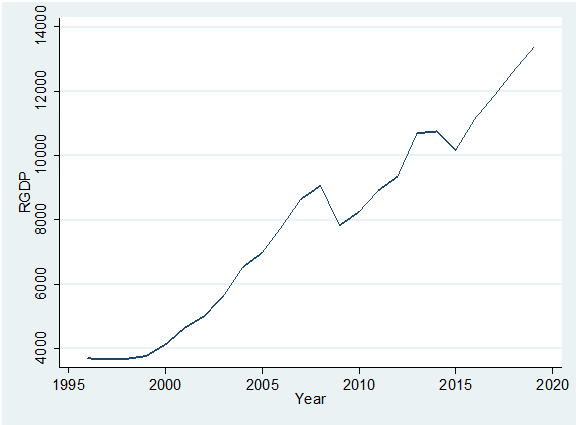
Figure-1. Broad money trend in Ukraine.
Figure 1 indicates two phases of broad money as an indicator of financial development for Ukraine from 1996 through 2019. During the first phase spanning from 1996-2013, the broad money of the country was in an increasing phase. However, it started decreasing after this period, which continues.
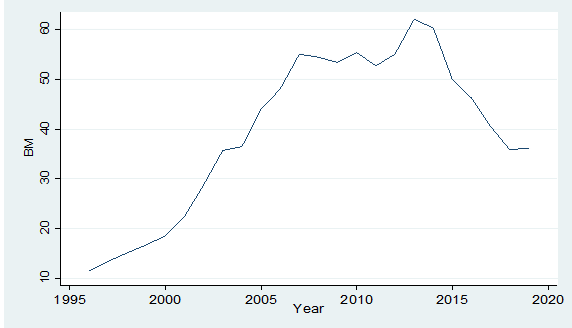
Figure-2 : Real GDP per capita Trend in Ukraine.
Figure 2 shows a continuously increasing trend of per capita real GDP during the period of 1996-2019 for Ukraine. A slight drop can be seen during the year 2008-09, however, it continued its increasing trend afterword’s which continues.
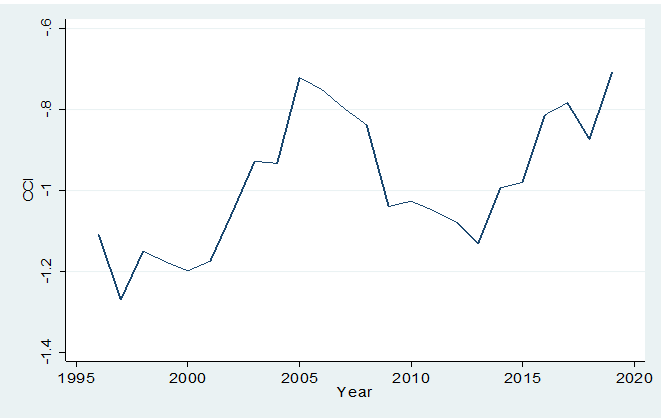
Figure-3. Corruption control index trend.
Figure 3 indicates three phases of the corruption control index for Ukraine from 1996 to 2019. It reports a decreasing trend during 1996-2005. The same has shown an increasing trend during 2005-2014. However, the corruption control index started to decrease after 2014, which continued until date.
1.2. Aims of Study
The present study was aimed at general investigating the impact of economic growth as well as corruption on the financial development of Ukraine. The specific research aims of this study were as follows:
a) To examine the influence of economic growth on the financial development of Ukraine from 1996 through 2019.b) To investigate the role of corruption in determining the financial development of Ukraine from 1996 through 2019.
c) To explore the long-run as well as the short-run effect of economic growth on the financial development of Ukraine during the period of study.
d) To determine the long-run as well as the short-run influence of corruption on the financial development of Ukraine during the period of study.
1.3. Research Questions
The aims of the research depend upon the careful analysis of data through hypothesis testing procedure, which ultimately seeks to answer the following research questions:
i) How economic growth influence the financial development of Ukraine from 1996 through 2019?ii) What is the impact of corruption on the financial development of Ukraine during the period of 1996-2019?
iii) Does the economic growth have a short-term or long-term influence on the financial development of Ukraine during the period of study?
iv) How does corruption affect the financial development of Ukraine in the long run, and the short run period during 1996-2019?
1.4. Significance of Research
Financial development decreases wealth inequality through improving disadvantaged and deprived people's access to funding, enabling risk management through lowering their sensitivity to shocks, including increasing investment opportunities, all of which lead to increased income production (Sunde, 2012). By assessing the impact of economic growth, and corruption on the financial development of Ukraine economy, the researchers would be able to suggest some precautionary measures about the level of corruption that must be controlled and the level of economic growth that must be required to enhance the financial development to the policymakers.
2. Literature Review
The present study is meant to explore the impact of economic growth, corruption on the financial development of Ukraine, during the period of study. The literature evidence including the conceptual review is stated below to achieve this purpose.
2.1. Conceptual Overview
2.1.1. Economic Growth
The rise or enhancement in the economic value of products generated by an economic system, adjusted for inflation. It can be measured sometimes just by GDP (Cavenaile & Sougné, 2012). However, most of the studies used real per capita GDP to assess the economic growth of their nation (Song, Chang, & Gong, 2021).
2.1.2. Corruption
It a kind of dishonesty or even a criminal act committed by a person as well as an organization entrusted with something like an authorized position and an intention to get illegal advantages or misuse power for personal gain (Goel & Mehrotra, 2012). The most widely used measure of corruption is the corruption control index (Muhammad & Fakunle, 2019; Song et al., 2021).
2.1.3. Financial Development
Financial depth, including the amount of private credit including market capitalization as just a percentage of GDP, is frequently used to assess financial development (Bettin & Zazzaro, 2012). A metric like this concentrates on the magnitude of financial development (Ono, 2012). Among others, broad money is the widely used measure for the indication of financial development in most of the literature research (Nnyanzi, Bbale, & Sendi, 2018; Song et al., 2021).
2.2. Critical Review
2.2.1. Economic Growth and Financial Development
Economic expansion, which may be referred to as one of the driving power as well as an engine of financial development, was seen as being a major factor (Hassan, Sanchez, & Yu, 2011). The research findings demonstrate that increased economic growth leads to more investment, which is the primary source of financial development (Adnan, 2011). Similarly, Kar, Nazlıoğlu, and Ağır (2011) discovered that economic growth as well as financial development, as indicated using broad money, have a two-way link. Likewise, Soytaş and Küçükkaya (2011) discovered that finance, as well as economic growth, have an interlinked link in emerging countries. In industrialized nations, however, the link does not present (Yudhvir & Sunita, 2012). Additionally, Adu, Marbuah, and Mensah (2013) discovered that economic growth is the consequence of some variables, with financial development playing a larger influence, unlike FDI. Financial development can help countries achieve economic progress (Pradhan, Mukhopadhyay, Gunashekar, Samadhan, & Pandey, 2013). Theoretically, reducing corruption contributes to under capital investment, which harms the growth of an economy (Uddin, Sjö, & Shahbaz, 2013). Finally, the majority of research investigation found a positive link between the growth of the economy and their financial development, such like the studies conducted by Caporale, Rault, Sova, and Sova (2015); Erdoğan, Yıldırım, and Gedikli (2020); Grassa and Gazdar (2014); Ibrahim and Alagidede (2018a); Ibrahim and Alagidede (2018b); Kumar and Paramanik (2020); Kyophilavong, Uddin, and Shahbaz (2016); Law and Singh (2014); Nain and Kamaiah (2014); Ono (2017); Sehrawat and Giri (2015a); Sehrawat and Giri (2015b); Shahbaz, Rehman, and Muzaffar (2015); Uddin et al. (2013).
2.2.2. Corruption and Financial Development
Shahbaz et al. (2015) discovered that corruption boosted the need for liquidity, resulting in better financial development. Similarly, Goto and Ogunnubi (2014) demonstrate that enormous corruption eats into the gains underlying financial development. However, Batabyal and Chowdhury (2015) argue the corruption remains harmful to financial development. Because corruption raises liquidity requirements, it can help to foster financial development (Adams & Klobodu, 2016). In the same way, corruption boosted the need for liquidity, it was more successful in promoting financial progress (Wang, 2016). It is shown by Jahanzeb and Aziz (2017) that financial development may help to reduce corruption. The significance of economic growth in the link of financial development with corruption can indeed be explained in part by the criterion effect (Muhammad & Fakunle, 2019). Corruption doesn't somehow stifle economic progress; on the alternative, it encourages the expansion of the economy as a whole (Ekşi & Doğan, 2020). However, Corruption promotes economic combined growth as well as acts as "greases" mostly in development engines Hung Son, Gia Khanh, and Thanh Liem (2020b). Corruption, according to popular belief, enhances the chance of positive deals that might not have occurred differently (Saied & Awad-Allah, 2020). The rationale is that when there is corruption, various types of government ineffective actions are addressed by people through unlawful measures such as bribery (Sharma & Paramati, 2020; Song et al., 2021).
2.3.Research Gap
The past literature indicated that there is a lack of assessing the link between corruption, economic growth, and financial development for the economy of Ukraine. Therefore, an empirical research investigation is needed to provide evidence for this economy.2.4. Theoretical Framework
Based on the aims, research questions, and past literature guidelines, the following theoretical model is established to examine the influence of economic growth, and corruption on the financial development of Ukraine, for the period of study in Figure 4.
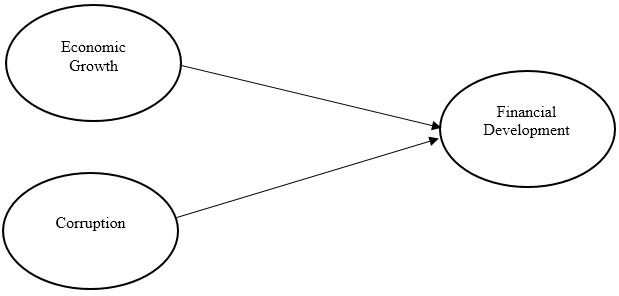
Figure-4. Theoretical Framework.
2.5. Research Hypothesis
The aims and research questions of the study require the analysis of data by testing the following set of hypotheses using the statistical procedure of time series analysis.
![]() : Financial development of Ukraine should strongly enhanced by economic growth during the period of study.
: Financial development of Ukraine should strongly enhanced by economic growth during the period of study.
![]() : Corruption strongly promotes financial development in Ukraine during the period of study.
: Corruption strongly promotes financial development in Ukraine during the period of study.
![]() : A long-run relationship between economic growth and financial development does exist in Ukraine during the period of study.
: A long-run relationship between economic growth and financial development does exist in Ukraine during the period of study.
![]() : A short-run relationship between economic growth and financial development does exist in Ukraine during the period of study.
: A short-run relationship between economic growth and financial development does exist in Ukraine during the period of study.
![]() : There should be a long-run relationship between corruption, and financial development in Ukraine during the period of study.
: There should be a long-run relationship between corruption, and financial development in Ukraine during the period of study.
![]() : There should be a short-run relationship between corruption, and financial development in Ukraine during the period of study.
: There should be a short-run relationship between corruption, and financial development in Ukraine during the period of study.
3. Data and Research Methodology
The research study was aimed at investigating the long-run as well as the short-run relationship of economic growth, and corruption on the financial development of Ukraine during the period of study 1996-2019. For achieving these objectives, the data was collected from WDI and the World Bank’s official website for the period of study. The target population of the study is Ukraine being in the group of the lower-middle-income level group from the region of Europe and East Asia. The data for financial development was available for Ukraine at world development indicators websites for an annual frequency ranging from 1992-2019. Similarly, the data for economic growth was available for Ukraine at the world development indicators website for an annual frequency ranging from 1990-2019. Finally, the data for corruption was taken from the world bank’s website for an annual frequency ranging from 1996-2019 for Ukraine. The final dataset was compiled in a time-series format using the annual frequency of 1996-2019 by considering the common year’s data availability for all the relevant variables.
3.1. Variable Measurements
The outcome variable of the study is financial development, which is measured by an indicator of broad money (percentage-age GDP). The data was available for this purpose on WDI’s website. Similarly, the economic growth as being the first independent variable of this study was measured by taking the natural log of real GDP per capita. The data for this variable was also obtained from WDI’s website. Finally, corruption as being the second independent variable of this study was measured by taking the corruption control index (CCI) as provided on the website of the world bank. The detailed explanation, indicator, measurement, data sources, and literature sources of the variables of the study are given in Table 1.
| Variable Name | Indicator | Measure | Data Source | Literature Source |
| Financial Development | Broad Money (BM) | Percentage of GDP | WDI/ IMF | (Hung Son, Gia Khanh, & Thanh Liem, 2020a; Saied & Awad-Allah, 2020; Sharma & Paramati, 2020; Song et al., 2021). |
| Economic Growth | Real GDP per capita (RGDP) | Natural Log of RGDP | WDI/IMF | (Kyophilavong et al., 2016; Saied & Awad-Allah, 2020; Song et al., 2021) . |
| Corruption | Control of Corruption Index (CCI) | Ranges between + 2.5, -2.5 | World Bank | (Hung Son et al., 2020a; Saied & Awad-Allah, 2020; Song et al., 2021). |
3.2. Econometric Modelling
The economic relationship between financial development, economic growth, and corruption for Ukraine can be established in time-series format as follows:
Where FD stands for financial development which is measured by an indicator of broad money; BM. Similarly, EG stands for economic growth, which is measured by an indicator of real GDP. Finally, COR stands for corruption, which is measured by an indicator of CCI; control of corruption. The model indicates financial development as a function of economic growth and corruption.
The basic time-series econometric model for the present research study is established as follows:
The above model serves the overall purpose/objective of the study by considering the main variables of the study. However, a more specific model used to achieve the objectives of the study based on indicators in transformed form is indicated in the following equation.
Where, BM = Broad money used for measuring financial development, Ln(RGDP) = log of real GDP per capita used for measuring the economic growth, and CCI = Corruption control index used for measuring the corruption.
The ARDL approach based on error correction model is established using the above set of variables in the following way:
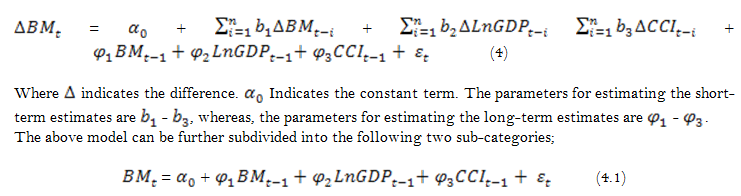
The above Equation 4.1 indicates the long run ARDL model, however, the short run, model using the same framework is established below.
Where ![]() is the parameter to estimate the error correction in the short run model of ARDL.
is the parameter to estimate the error correction in the short run model of ARDL.
3.3. Method of Estimations
The present study uses data ranging from 1996-2019, covering 24 observations as the annual frequency in the form of short time series which requires the analysis of this data in the following order.
- Line graph of each variable.
- Descriptive summary of variables.
- Unit root testing.
- Optimal lag selection.
- Co-integration testing (using bound test).
- ARDL estimations (short run, and long-run).
- Diagnostic testing (assumptions of ARDL).
4. Data Analysis
The present research investigation aimed at estimating the impact of economic growth, and corruption on the financial development of Ukraine for the short-run and long-run during the period of study 1996-2019. For achieving these aims of the study, it required to form a time series dataset based on common years of availability (1996-2019). The analysis of the data as per the objectives, research questions, and hypothesis requires several statistical procedures. Firstly, three different line graphs were estimated for measuring the trend of each variable during the period of study and were reported in the introductory part of this study. Secondly, descriptive statistics, ADF, and PP unit root testing, lag selection for measuring the optimal lags in the dataset, co-integration for testing the existence of a long-run relationship between the variables of the study, and finally the error correct ARDL process along-with their assumptions were used in the analysis of this study.
4.1. Descriptive Statistics
The study summarized the variables; financial development (measured by BM), economic growth (RGDP), and corruption (measured by CCI) in the form of mean, standard deviation, minimum, maximum, kurtosis, skewness, and some observations (N). The detailed interpretation of this table is explained under Table 2 as follows.
| Variables | Mean |
S.D |
Kurtosis |
Skewness |
Min |
Max |
N |
| BM | 39.50 |
16.12 |
-1.14 |
-0.44 |
11.49 |
62.04 |
24.00 |
| RGDP | 7835 |
3068 |
-1.16 |
0.07 |
3671 |
13341.21 |
24.00 |
| CCI | -0.98 |
0.17 |
-1.13 |
0.15 |
-1.27 |
-0.71 |
24.00 |
The Table 2 indicates that broad money as a measure of financial development counts for 39.50 % of Ukraine’s overall GDP from 1996 through 2019 with a standard deviation of 16.12%. The minimum percentage age of GDP as broad money during the same period was 11.49% while the maximum of the same was 62.04%. Similarly, the per capita real GDP of Ukraine during 1996-2019 was on average counts for 7835 USD with a standard deviation of 3068$. Ukraine comes under a lower middle-level income group in the region of Europe and Central Asia. The minimum per capita real GDP of Ukraine during the period of 1996-2019 is 3671 USD while the maximum of the same was 13341.21 USD. Finally, the level of corruption is indicated by CCI; the corruption control index. This measure of corruption is ranged between the values of Plus 2.5 and minus 2.5. Where a value between zeros to +2.5 indicates a corruption-free state of Government while a value between zeros to -2.5 indicates a higher degree of a corrupt government. The table indicates that the average value of the corruption control index in Ukraine during the period of 1996-2019 is -0.98, which indicates a moderately corrupt Government in this country with a standard deviation of 0.17. The minimum level of corruption index is -1.27 while the maximum level of the same is -0.71.
4.2. Testing the Unit Root
Table 3 below reports the test statistic values for Augmented Dicky Fuller, as well as Philips & Perron tests of stationarity. The table reports the test statistic values of both tests at the level and the first difference for three variables; broad money (as an indicator of financial development), natural log of real GDP per capita (as an indicator of economic growth), and corruption control index (as an indicator of corruption) in the present study. The detailed interpretation is given under Table 3 as follows.
ADF |
PP |
|||
| Variables | Level |
First Difference |
Level |
First Difference |
| BM | -1.386 |
-4.111*** |
1.197 |
-3.766** |
| LnRGDP | -2.880* |
-4.534*** |
-2.650 |
-4.760*** |
| CCI | -1.635 |
-3.470** |
-1.744 |
-4.943*** |
Note: * significant at 0.10, ** significant at 0.05, *** significant at 0.01. |
Table 3 reports unit root testing procedure at the level as well as at first difference for three different indicators; Broad money, natural log of real GDP per capita, and CCI. The table confirms the stationarity of two variables (BM, and CCI) at first difference only. However, the natural log of real per capita GDP indicates weak stationarity at level, strong stationarity at the first difference using both tests; ADF, and PP.
4.3. Optimal Lag Selection
The lag indicates the lapse of time required to measure the response of the dependent variable towards the independent variable. Careful consideration is required to select the optimal level of lag. The higher level of lags can cause to decrease in the degree of freedom, which ultimately can create unstable estimations. The optimal lag length using AIC, HQIC, SBIC as the three major criteria of optimal lag selection are reported below in Table 4.
Selection-order criteria
Sample: 1998 - 2019 Number of obs = 22
Lag |
LL |
LR |
df |
p |
FPE |
AIC |
HQIC |
SBIC |
0 |
-75.749 |
0.258 |
7.159 |
7.194 |
7.308 |
|||
1 |
-4.014 |
143.47* |
9 |
0 |
0.0009* |
1.455* |
1.596* |
2.051* |
2 |
1.312 |
10.652 |
9 |
0.3 |
0.001 |
1.79 |
2.035 |
2.831 |
Table 4 indicated the optimal lag length as “1” as per the criteria of AIC, HQIC, and SBIC.
4.4. Bound Testing
Table 5 reports the co-integration testing of the long-run relationship between the variable of study using the bound testing procedure of the ARDL process. The table indicates the test statistic values for F and t, as well as their critical values based on significance levels in the percentage of 1, 2.5, 5, and 10. The null hypothesis for this test is that there is no co-integration between the variables of the study. If the test statistic value of F > upper bound I(1) values, the null hypothesis is rejected. Similarly, if the t-value of test statistics is less than the upper bound I(1), the null hypothesis is rejected.
Test Statistics F-value = 6.513 T-value = 2.852 |
Critical Values Based on F-test |
Critical Values-Based on T-test |
||
Significance Level (%) |
I (0) |
I (1) |
I (0) |
I (1) |
1 |
5.15 |
6.36 |
-3.43 |
-4.1 |
2.5 |
4.41 |
5.52 |
-3.13 |
-3.8 |
5 |
3.79 |
4.85 |
-2.86 |
-3.53 |
10 |
3.17 |
4.14 |
-2.57 |
-3.21 |
| Dependent Variable = Broad Money (BM) | Coef. |
Std. Err. |
t |
P>t |
| Adjustment | ||||
| BM | ||||
| L1. | 0.50 |
0.21 |
2.4 |
0.0330 |
| Long-Run | ||||
| LnGDP | 69.58 |
11.98 |
5.81 |
0.0020 |
| CCI | -48.00 |
20.16 |
-2.38 |
0.0350 |
| Short Run | ||||
| BM | ||||
| LD. | -1.05 |
0.43 |
-2.46 |
0.0570 |
| L2D. | -0.93 |
0.34 |
-2.77 |
0.0400 |
| L3D. | -0.38 |
0.39 |
-0.97 |
0.3780 |
| LnGDP | ||||
| D1. | 78.21 |
18.35 |
4.26 |
0.0080 |
| LD. | 79.58 |
19.11 |
4.16 |
0.0090 |
| L2D. | 74.01 |
17.66 |
4.19 |
0.0090 |
| L3D. | 42.75 |
15.48 |
2.76 |
0.0400 |
| CCI | ||||
| D1. | -16.39 |
7.69 |
-2.13 |
0.0860 |
| LD. | -39.11 |
7.49 |
-5.22 |
0.0030 |
| L2D. | -30.23 |
12.15 |
-2.49 |
0.0550 |
| L3D. | -27.10 |
11.35 |
-2.39 |
0.0630 |
| Constant | 307.00 |
119.19 |
2.58 |
0.050 |
| R-square | 0.9383 |
|||
| R-square Adjusted | 0.7655 |
|||
| Diagnostic Tests | ||||
|
4.19 |
|||
|
2.71 |
|||
|
0.04 |
|||
|
0.13 |
|||
|
0.88 |
|||
|
1.28 |
Table 5 indicates an F-values of test statistics as 6.513 which is greater than the f-test critical values from upper bound I(1). Similarly, the t-values from test statistics are indicated as 2.852 which is less than the t-test critical values. Therefore, the null hypothesis is rejected and it is inferred that a long-run relationship exists between the variables of the study.
4.5. ARDL Estimations
Table 6 reports the error corrected ARDL estimates for the study. It includes the long-run as well as the short-run estimates for independent variables (economic growth, and corruption), and dependent variables (financial development) for Ukraine for the period of 1996-2019. Additionally, assumptions of ARDL estimations were also reported at the bottom of Table 6. The further explanations of ARDL estimations and inference of the study are explained below the table.
- Economic Growth and Financial Development
Table 6 indicates and confirms a long-run as well as a short-run relationship with a highly significant impact of economic growth and financial development in Ukraine for the period of study 1996-2019. The financial development of Ukraine during the period of study is strongly enhanced by 69.58% in the long run, and 78.21% in the short run through economic growth as measured by the natural log of per capita GDP. The longer and shorter relationship between both variables of the study are constant with the comparable outcomes as verified by Adu et al. (2013); Caporale et al. (2015); Cavenaile and Sougné (2012); Grassa and Gazdar (2014); Hassan et al. (2011);Ibrahim and Alagidede (2018a); Kyophilavong et al. (2016); Ono. (2017); Song et al. (2021). The positive relationship between economic growth and financial development is Ukraine during the period of the study confirms the acceptance of the first Hypothesis (![]() ). However, some of the past evidence does not support the positive link between economic growth and financial development, (e.g., (Law & Singh, 2014; Sehrawat & Giri, 2015a, 2015b; Shahbaz et al., 2015; Uddin et al., 2013)). Similarly, the existence of a long-run relationship between economic growth and financial development accepted the
). However, some of the past evidence does not support the positive link between economic growth and financial development, (e.g., (Law & Singh, 2014; Sehrawat & Giri, 2015a, 2015b; Shahbaz et al., 2015; Uddin et al., 2013)). Similarly, the existence of a long-run relationship between economic growth and financial development accepted the ![]() , while the existence of short run relationship between both the variables accepted
, while the existence of short run relationship between both the variables accepted ![]() . It is inferred from the findings of study that financial development of Ukraine is strongly boosted by economic growth both in the long run and in the short run.
. It is inferred from the findings of study that financial development of Ukraine is strongly boosted by economic growth both in the long run and in the short run.
- Corruption and Financial Development
Table 6 above also indicates a negative and highly significant relationship between corruption, and financial development in the long run for Ukraine during the period of 1996-2019. Similarly, a negative and weakly significant link was observed between corruption and financial development in the short run for Ukraine during the period of study. The negative link between corruption and financial development in Ukraine rejects the second hypothesis. However, the existence of long run, as well as short run relationship between the variable of the study, accepts the![]() , and
, and ![]() hypothesis. The long-run relationship indicates that the financial development of Ukraine during the period of study is strongly decreased by 48%. The short-run link between the variable of the study indicates ha the financial development of Ukraine during the period of study is strongly decline by 16.39 % if corruption increases 1% in long run as well as in long run. The results of this study are comparable with the similar findings of Adams and Klobodu (2016); Batabyal and Chowdhury (2015); Ekşi and Doğan (2020); Goto and Ogunnubi (2014); Muhammad and Fakunle (2019); Wang (2016); Yudhvir and Sunita (2012). However, the results of the present research investigation were not comparable with the positive link between the variable from the studies (Ekşi & Doğan, 2020; Saied & Awad-Allah, 2020; Song et al., 2021). It is inferred from the evidence of this study the corruption contributes negatively to explaining the financial development of Ukraine during the period of study for the long run, as well as in the short run.
hypothesis. The long-run relationship indicates that the financial development of Ukraine during the period of study is strongly decreased by 48%. The short-run link between the variable of the study indicates ha the financial development of Ukraine during the period of study is strongly decline by 16.39 % if corruption increases 1% in long run as well as in long run. The results of this study are comparable with the similar findings of Adams and Klobodu (2016); Batabyal and Chowdhury (2015); Ekşi and Doğan (2020); Goto and Ogunnubi (2014); Muhammad and Fakunle (2019); Wang (2016); Yudhvir and Sunita (2012). However, the results of the present research investigation were not comparable with the positive link between the variable from the studies (Ekşi & Doğan, 2020; Saied & Awad-Allah, 2020; Song et al., 2021). It is inferred from the evidence of this study the corruption contributes negatively to explaining the financial development of Ukraine during the period of study for the long run, as well as in the short run.
- ARDL Assumptions
The bottom of Table 6 indicates the assumption testing of the ARDL model through some diagnostic measures like LM test, DW test, Reset test, Arch Test, Ramsey, and White test. By meeting the ARDL model’s assumption, the estimation becomes reliable and valid. These assumptions include that there should be no autocorrelation, absence of heteroscedasticity, the validity of functional formation of model, and normality. The results from the relevant diagnostic test revealed that all the assumptions of the ARDL model were met, and no issues were found from the required set of data.
5. Conclusions and Recommendations
The present research study aimed to examine the long-run as well as the short-run impact of economic growth on the financial development of Ukraine during the period of study 1996-2019. The outcome variable of the study was financial development which was measured using broad money as measured by the percentage of GDP. The independent variables include economic growth as measured by taking the natural log of per capita real GDP and corruption which is measured by the corruption control index. The data for broad money, and per capita real GDP was obtained from the official website of world development indicators while for corruption control index data was obtained from the world’ bank official website for this purpose. A time-series analysis was executed by estimating line trend, descriptive statistics, stationarity testing, co-integration test, optimal lag estimation, and error-corrected model of ARDL. The analysis of time series data for this study revealed stationarity for all the three variables at the first difference using ADF, and PP testing for unit root. Additionally, co-integration testing using ARDL bound test approach revealed the existence of long-run relationships between the outcome and input variables of the study. All the assumptions of ARDL estimations were met. The findings of ARDL estimations using error-corrected versions proved that economic growth and corruption strongly influencing the financial development of Ukraine during the period of study 1996-2019. The economic growth proved to be positive while the corruption proved to be negatively influencing the financial development of Ukraine during the period of study. All the hypotheses of this study were accepted excluding the second hypothesis, which was established based on the positive link between corruption and financial development. It is inferred from the findings of this study that the financial development of Ukraine during 1996-2019 is strongly boosted by economic growth while the same is strongly declined by corruption in the long term as well as in the short term. The policymakers in Ukraine should carefully take steps to enhance their per capita real GDP to enhance financial development. However, they need to take some series of steps to control their increasing trend of corruption, as it will harm their level of financial development. The evidence of this study applies to single-country time series analysis. The study is generable to other countries in comparative mode with lower-middle-income level category. The findings are not generable to the country with higher levels of income. Future studies may include some more indicators of corruption as well and economic growth that may influence financial development.
References
Adams, S., & Klobodu, E. K. M. (2016). Financial development, control of corruption and income inequality. International Review of Applied Economics, 30(6), 790-808. Available at: 10.1080/02692171.2016.1208740.
Adnan, H. Q. M. (2011). 6 financial development index and economic growth: Empirical evidence From India. Asian Economic Review, 53(1), 98-111. Available at: 10.1108/15265941111112820.
Adu, G., Marbuah, G., & Mensah, J. T. (2013). Financial development and economic growth in Ghana: Does the measure of financial development matter? Review of Development Finance, 3(4), 192-203. Available at: 10.1016/j.rdf.2013.11.001.
Batabyal, S., & Chowdhury, A. (2015). Curbing corruption, financial development and income inequality. Progress in Development Studies, 15(1), 49-72. Available at: 10.1177/1464993414546980.
Bettin, G., & Zazzaro, A. (2012). Remittances and financial development: Substitutes or complements in economic growth? Bulletin of Economic Research, 64(4), 509-536. Available at: 10.1111/j.1467-8586.2011.00398.x.
Caporale, G. M., Rault, C., Sova, A. D., & Sova, R. (2015). Financial development and economic growth: Evidence from 10 new European Union members. International Journal of Finance & Economics, 20(1), 48-60. Available at: 48-60. DOI: 10.1002/ijfe.1498.
Cavenaile, L., & Sougné, D. (2012). Financial development and economic growth: An empirical investigation of the role of banks and institutional investors. Applied Financial Economics, 22(20), 1719-1725. Available at: 10.1080/09603107.2012.676731.
Ekşi, İ. H., & Doğan, B. (2020). Corruption and financial development: Evidence from Eastern Europe and Central Asia countries. Focus – Finances of Emerging Markets, 65(2), 196-209.
Erdoğan, S., Yıldırım, D. Ç., & Gedikli, A. (2020). Natural resource abundance, financial development and economic growth: An investigation on Next-11 countries. Resources Policy, 65, 101559. Available at: https://doi.org/10.1016/j.resourpol.2019.101559.
Goel, R. K., & Mehrotra, A. N. (2012). Financial payment instruments and corruption. Applied Financial Economics, 22(11), 877-886. Available at: 10.1080/09603107.2011.628295.
Goto, K., & Ogunnubi, O. (2014). Corruption and development in Africa: Critical reflections from post-apartheid South Africa. Lumina, 25(1), 48-69.
Grassa, R., & Gazdar, K. (2014). Financial development and economic growth in GCC countries: A comparative study between Islamic and conventional finance. International Journal of Social Economics, 41, 493-514. Available at: 10.1108/IJSE-12-2012-0232.
Hassan, M. K., Sanchez, B., & Yu, J.-S. (2011). Financial development and economic growth: New evidence from panel data. The Quarterly Review of Economics and Finance, 51(1), 88-104. Available at: 10.1016/j.qref.2010.09.001.
Hung Son, T., Gia Khanh, H. C., & Thanh Liem, N. (2020a). Credit information sharing, corruption and financial development: International evidence. Cogent Business & Management, 7(1), 1-15. Available at: 10.1080/23311975.2020.1851856.
Hung Son, T., Gia Khanh, H. C., & Thanh Liem, N. (2020b). Credit information sharing, corruption and financial development: International evidence. Cogent Business & Management, 7(1), 1851856. Available at: 10.1080/23311975.2020.1851856.
Ibrahim, M., & Alagidede, P. (2018a). Effect of financial development on economic growth in sub-Saharan Africa. Journal of Policy Modeling, 40(6), 1104-1125. Available at: 10.1016/j.jpolmod.2018.08.001.
Ibrahim, M., & Alagidede, P. (2018b). Nonlinearities in financial development–economic growth nexus: Evidence from sub-Saharan Africa. Research in International Business and Finance, 46, 95-104. Available at: 10.1016/j.ribaf.2017.11.001.
Jahanzeb, A., & Aziz, T. (2017). Nexus between corruption and economic Growth: ARDL bounds testing approach. Journal of Applied Finance and Economic Policy, 1(1), 18-24.
Kar, M., Nazlıoğlu, Ş., & Ağır, H. (2011). Financial development and economic growth nexus in the MENA countries: Bootstrap panel granger causality analysis. Economic Modelling, 28(1-2), 685-693. Available at: 10.1016/j.econmod.2010.05.015.
Kumar, K., & Paramanik, R. N. (2020). Nexus between Indian economic growth and financial development: A non-linear ARDL approach. The Journal of Asian Finance, Economics, and Business, 7(6), 109-116.
Kyophilavong, P., Uddin, G. S., & Shahbaz, M. (2016). The nexus between financial development and economic growth in Lao PDR. Global Business Review, 17(2), 303-317. Available at: 10.1177/0972150915619809.
Law, S. H., & Singh, N. (2014). Does too much finance harm economic growth? Journal of Banking & Finance, 41, 36-44. Available at: 10.1016/j.jbankfin.2013.12.020.
Muhammad., S., & Fakunle, S. O. (2019). Judicial corruption, financial development, and economic growth: Fresh Evidence from Nigeria. East African Scholars Journal of Economics, Business and Management, 2(3), 94-105.
Nain, M. Z., & Kamaiah, B. (2014). Financial development and economic growth in India: Some evidence from non-linear causality analysis. Economic Change and Restructuring, 47(4), 299-319. Available at: 10.1007/s10644-014-9151-5.
Nnyanzi, J. B., Bbale, J. M., & Sendi, R. (2018). Financial development and tax revenue: How catalytic are political development and corruption. International Journal of Economics and Finance, 10(8), 92-104. Available at: 10.5539/ijef.v10n8p92
Ono, S. (2012). Financial development and economic growth: Evidence from Russia. Europe-Asia Studies, 64(2), 247-256. Available at: 10.1080/09668136.2012.635484.
Ono, S. (2017). Financial development and economic growth nexus in Russia. Russian Journal of Economics, 3(3), 321-332. Available at: 10.1016/j.ruje.2017.09.006.
Pradhan, R. P., Mukhopadhyay, B., Gunashekar, A., Samadhan, B., & Pandey, S. (2013). Financial development, social development, and economic growth: The causal nexus in Asia. Decision, 40(1), 69-83. Available at: 10.1007/s40622-013-0011-3.
Saied, A. E., & Awad-Allah, M. M. (2020). The impact of corruption on financial development in Africa. Noble International Journal of Economics and Financial Research, 5(2), 32-39.
Sehrawat, M., & Giri, A. (2015a). Financial development and economic growth: Empirical evidence from India. Studies in Economics and Finance, 32(3), 340-356. Available at: 10.1108/SEF-10-2013-0152.
Sehrawat, M., & Giri, A. (2015b). The role of financial development in economic growth: Empirical evidence from Indian states. International Journal of Emerging Markets, 10(4), 765-780. Available at: 10.1108/IJoEM-05-2014-0064.
Shahbaz, M., Rehman, I. U., & Muzaffar, A. T. (2015). Re-visiting financial development and economic growth nexus: The role of capitalization in Bangladesh. South African Journal of Economics, 83(3), 452-471.
Sharma, C., & Paramati, S. R. (2020). Does financial development reduce the level of corruption? Evidence from a global sample of 140 countries. International Journal of Finance & Economics, 1-17. Available at: https://doi.org/10.1002/ijfe.2056.
Song, C.-Q., Chang, C.-P., & Gong, Q. (2021). Economic growth, corruption, and financial development: Global evidence. Economic Modelling, 94, 822-830. Available at: 10.1016/j.econmod.2020.02.022.
Soytaş, U., & Küçükkaya, E. (2011). Economic growth and financial development in Turkey: new evidence. Applied Economics Letters, 18(6), 595-600. Available at: 10.1080/13504851003761764.
Sunde, T. (2012). Financial sector development and economic growth nexus in South Africa. International Journal of Monetary Economics and Finance, 5(1), 64-75. Available at: 10.1504/IJMEF.2012.044467.
Uddin, G. S., Sjö, B., & Shahbaz, M. (2013). The causal nexus between financial development and economic growth in Kenya. Economic Modelling, 35, 701-707. Available at: 10.1016/j.econmod.2013.08.031.
Wang, L. (2016). The impacts of anti-corruption on economic growth in China. Modern Economy, 7(2), 109-117. Available at: 10.4236/me.2016.72013.
Yudhvir, M., & Sunita, M. (2012). Corruption: Impacts and measures to control. Asian Journal of Multidimensional Research, 1(2), 28-34.