The Differences in Mean and Volatility Shock Transmission among Bitcoin, Currencies from Developed Countries, and Currencies from Emerging Countries
Boubaker TOUIJRAT1*
Brahim BENAID2
Hassane BOUZAHIR3
1,2,3ISTI Lab, ENSA, Ibno zohr University-Agadir, Morocco. |
AbstractThis paper studied the mean and volatility transmission among Bitcoin as the most prominent cryptocurrency, exchange rates from developed countries/regions, and exchange rates from emerging countries/regions. Using daily returns between January 1, 2015, and December 31, 2018, and Bivariate VAR - Diagonal VECH models. The empirical results suggest there was no mean transmission between USD/EUR and USD/BTC. However, there was a unidirectional mean shock transmission link from USD/CNH, USD/MAD, and USD/IDR to USD/BTC. The results also suggested the existence of a bidirectional cross-volatility persistence link between bitcoin and all the exchange rates, except for USD/IDR and a bidirectional cross-volatility spillover link between USD/BTC and USD/CNH. A critical implication of these results is that they will be of use to investors, speculators, risk managers, and policymakers in understanding the degree of integration in terms of volatility and return among Bitcoin, currencies from developed, and currencies from emerging countries. |
Licensed: |
|
Keywords: JEL Classification |
|
Received: 16 August 2021 |
|
| (* Corresponding Author) |
Funding: This study received no specific financial support. |
Competing Interests:The authors declare that they have no competing interests. |
1. Introduction
With Bitcoin's emergence as the first and, to date, most popular cryptocurrency, focus turned to this new asset, particularly in 2016 and 2017. It gained much traction in the investing world and the financial press. Bitcoin's price grew by more than 1,358 percent in 2017, valuing it at more than 215 billion dollars. The Chicago Mercantile Exchange (CME) Group was the first to recognize Bitcoin as a genuine asset. As a result, in December 2017, the Chicago Board Options Exchange (CBOE) issued futures contracts to maintain the value of Bitcoin. Many market players see this as a sign that Bitcoin has gained ground as a legitimate investment instrument. As a result, study on the return and volatility relationship between Bitcoin and other asset classes is vital. Bitcoin is characterized by exceptionally high returns and volatility (Baek & Elbeck, 2015), which might have an impact on many asset classes and, as a result, the economic system's stability (European Central Bank, 2012). Any indication of substantial return and volatility Shocktransfers between Bitcoin and other asset classes has an impact on asset selection and allocation, risk management choices, and regulatory measures aimed at ensuring the global financial system's stability. It's also essential for governments contemplating Bitcoin as part of their foreign reserves or experimenting with their own Bitcoin equivalents. From a theoretical economic standpoint, Ali, Barrdear, Clews, and Southgate (2014) suggest that a digital currency like Bitcoin might be classified as money based on how well it serves the three cardinal functions of cash, namely store of value, medium of exchange, and unit of account. These economic activities, however, are acknowledged to be time variable and are insufficient for digital currencies to be deemed money for legal and regulatory purposes. While digital currencies are now used by a small number of individuals and are mostly used as a store of value, Reyes (2016) draws on endogenous economic regulation, endogenous development, and functional financial regulation theories. Decentralized automation, such as blockchain technology and its underlying payment systems such as Bitcoin, Reyes claims, firmly support the concept of endogenous, technology-assisted regulation. Li and Wang (2017) provide a theory-driven approach to understanding technological adoption and monetary economics theories. Bitcoin is regarded as a value-transfer economic tool that, like other monetary instruments, is progressively maturing into a competent position. In the long run, it is consistent with economic fundamentals. Finally, Luis, de la Fuente, and Perote (2019) suggest that, in addition to its other functions, Bitcoin fits well with the evolutionary theory of money because it optimizes transactions among economic agents.
To date, the few studies that have looked at the relationship between Bitcoin and financial factors have only looked at a few assets at a time, such as UK stocks, EUR/USD, and GBP/USD (Dyhrberg, 2016a). Notably, the current literature does not contain any empirical studies on the return and volatility spillovers between Bitcoin and other currency rates. Therefore, this study attempts to address these gaps:
- No statistical analyses of mean and volatility spillovers have been conducted between Bitcoin, Chinese, European, Moroccan, and Indonesian currencies.
- No empirical research looks at the differences in spillovers between countries that have prohibited cryptocurrencies and those that have not.
- No empirical research investigates the differences in the mean and volatility spillovers between Bitcoin, developed-country currencies, and emerging-market currencies.
First, we considered a rich set of four exchange rates, namely USD/EUR, USD/CNH, USD/MAD, and USD/IDR. We selected emerging markets (Morocco and Indonesia) because of the growing popularity of Bitcoin in these nations. We also concentrated on China since Bitcoin is utilized there to circumvent capital controls, and China was one of the first states to accept cryptocurrencies with enthusiasm. Second, from January 1, 2015, to December 31, 2018, we employed a newly developed multivariate econometric approach called VaR–GARCH in the mean framework with the Diagonal VECH representation. This research might lead to a better understanding of Bitcoin's ability to function as a diversifier or hedge against these types of exchange rates.
2. Literature Review
Investors and speculators with various levels of risk appetite can benefit from well-functioning transaction platforms supported by blockchain technology. Liu and Serletis (2019) challenge the notion that Bitcoin investments are risky. Bitcoin’s typical daily price movements are up to ten times greater than those of the regular currency market, and it is mostly driven by speculation. Similarly, Kyriazis and Prassa (2019) point out that, while Bitcoin investments can be extremely risky, they can also be quite rewarding, particularly during bullish market episodes. Given Bitcoin's extreme volatility, our research suggests that bearish markets have investment and profit-making possibilities. As a result, including Bitcoin in a well-diversified portfolio has been observed to be highly appealing, see (Briere, Oosterlinck, & Szafarz, 2015; Halaburda & Gandal, 2014), given that Bitcoin average returns have stayed significantly high since its inception (Bouri, Gupta, Tiwari, & Roubaud, 2017a). Ji, Bouri, Kristoufek, and Lucey (2019) have recently demonstrated that steady asset removal relates more to Bitcoin exchange volatility connectivity than trade volume. The breadth of research on cryptocurrencies has grown exponentially in recent years, with Corbet, Lucey, Urquhart, and Yarovaya (2019) providing a thorough review of such developments, highlighting price efficiency, price volatility, and the presence of criminality as pressing issues within the products and exchanges on which they trade. Many research that have looked at the link between Bitcoin and other assets, such as Bouri et al. (2017a), Bouri, Das, Gupta, and Roubaud (2018), Guesmi, Saadi, Abid, and Ftiti (2019), and Aslanidis, Fernandez Bariviera, and Martínez-Ibañez (2019) have shown substantial evidence of a weak correlation. Bitcoin has many similar characteristics to gold and, as a result, the dollar, whether it's in terms of hedging capacities or as a means of trade (Trabelsi, 2018). However, Bouri, Jalkh, Molnár, and Roubaud (2017b) show that Bitcoin may be a safe haven and a solid hedge against commodities indexes. Bouri, Shahzad, and Roubaud (2019) use the cross-quantilogram technique to explore the connection and directional predictability from US stock sectors to eight cryptocurrencies (Han, Linton, Oka, & Whang, 2016). Some cryptocurrencies, they claim, may be useful digital asset classes. Bitcoin is advantageous as a diversifier, according to Baek and Elbeck (2015), due to its low correlation with bonds and stocks. Briere et al. (2015) investigated the relationship between Bitcoin and a variety of conventional (worldwide equity indices, bonds, fiat currencies) and unconventional (commodities, hedge funds, real estate) assets and found that, despite Bitcoin's high volatility, allocating 3% of a well-diversified portfolio to Bitcoin can often improve the risk-return trade-off of well-diversified portfolios. Ji, Bouri, Gupta, and Roubaud (2017) utilized a directed acyclic graph method to show that Bitcoin can help diversify portfolios owing to its separation from traditional assets. These earlier research, on the other hand, used an unconditional correlation analysis and did not take into consideration return and volatility Shocktransmissions, especially in different market situations. Using univariate GARCH, Dyhrberg (2016b) demonstrated Bitcoin's capacity to hedge against currency and stock market fluctuations in the UK. Multivariate GARCH models, on the other hand, are frequently found to disclose more about market linkages. Using regression models with dummy variables as supplements, (Demir, Gozgor, Lau, & Vigne, 2018) utilize quantile-on-quantile regressions to investigate the relationship between Bitcoin and the economic policy uncertainty index, and discover that Bitcoin is frequently used for hedging against uncertainty. Gajardo, Kristjanpoller, and Minutolo (2018) use MF-ADCCA to investigate the existence and asymmetry of cross-correlation between currency rates, Bitcoin, the DJIA, gold prices, and crude oil prices. Their findings show that Bitcoin's association with commodities differs from its relationship with stock market indexes.
Zhang, Wang, Li, and Shen (2018) discovered persistent cross-correlation between the calculated index and the Dow Jones Industrial Average when designing a cryptocurrency composite index. As demonstrated by Chaim and Laurini (2018), such cross-correlations are also vulnerable to the occurrence of persistent levels of high unconditional volatility with rapid, abrupt price swings. Similarly, Bouri et al. (2018) discovered that Bitcoin price swings are quite comparable to those of different assets, especially commodities, indicating that Bitcoin is not totally isolated. There is, however, no empirical evidence of differences in return and volatility spillovers between Bitcoin, developed-country currencies, and emerging-country currencies.
3. Econometric Methodology
To examine the linkage differences among Bitcoin, currencies from developed countries, and currencies from emerging countries, we conducted the ARCH LM test to justify the GARCH model choice, then we constructed four bivariate VaR-DVECH models to capture return and volatility spillover effects, and finally, we conducted both residual diagnostics and a Wald test to confirm the adequacy and stability of our models.
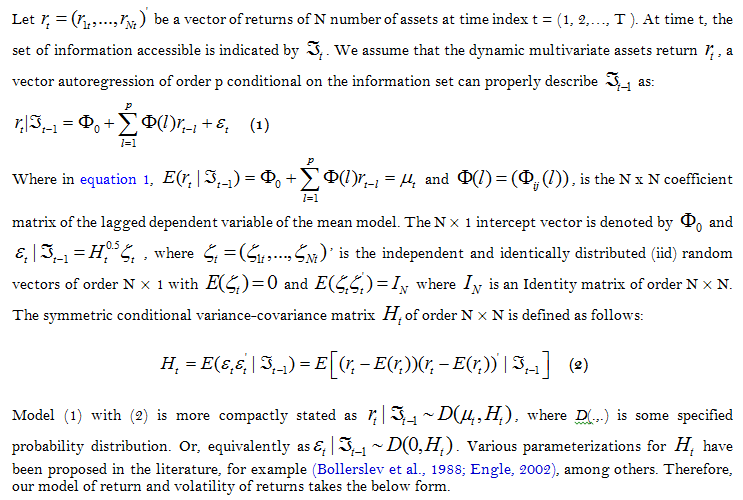
3.1. Conditional Mean, Covariance, and Variance Models
To examine the mean and volatility spillovers among the USD/BTC, USD/EUR, USD/CNH, USD/MAD, and USD/IDR exchange rates, we used a multivariate VaR-GARCH model. VaR-DVEC was developed by Bollerslev, Engle, and Wooldridge (1988) because the unrestricted VECH model in the simplest case of two assets contains 21 parameters. Estimating the unrestricted VECH model can quickly become unfeasible as the number of assets employed in the model increases.
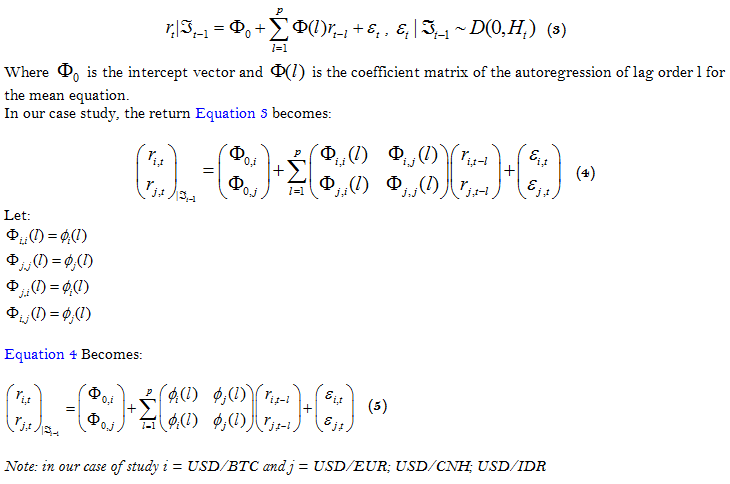
3.2.Return Equations
3.3. Variance-Covariance Model
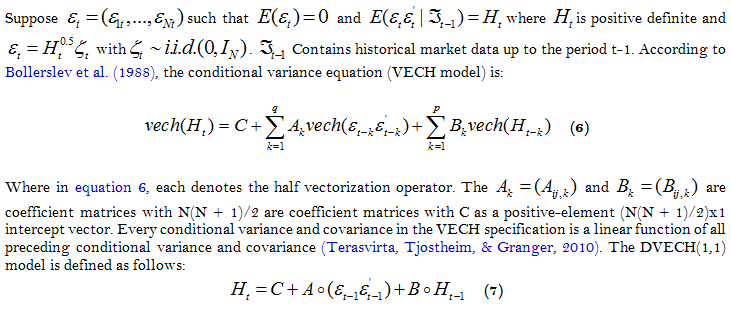
with ![]() as the Hadamard product. The C, A, and B are N × N symmetric matrices in equation 7, and it assumes that A and B in Equation8 are diagonal. The equation can be written as:
as the Hadamard product. The C, A, and B are N × N symmetric matrices in equation 7, and it assumes that A and B in Equation8 are diagonal. The equation can be written as:
3.4. Estimation Method
The conditional mean-variance system can be estimated jointly under the assumption of conditional normality. Maximizing the log-likelihood function may be used to estimate the parameters of multivariate VAR-GARCH models for any of the above specifications.
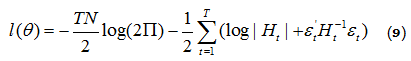
Where ![]() stand for all the unknown parameters to be estimated, N stands for the number of assets, T stands for the number of observations, and the rest of the notation is the same as before. Because the maximum-likelihood estimate
stand for all the unknown parameters to be estimated, N stands for the number of assets, T stands for the number of observations, and the rest of the notation is the same as before. Because the maximum-likelihood estimate ![]() is asymptotically normal, standard statistical inference techniques may be used.
is asymptotically normal, standard statistical inference techniques may be used.
3.5. Residual Diagnostic
In multivariate conditional heteroscedasticity models, portmanteau statistics (Box & Pierce, 1970) have been employed as a benchmark for diagnosing model inadequacies. This test, which is based on cross products of standardized residuals, is frequently used as a diagnostic tool. Denoting ![]() and the elements of
and the elements of ![]() , we define i-th standardized residuals at time t as
, we define i-th standardized residuals at time t as
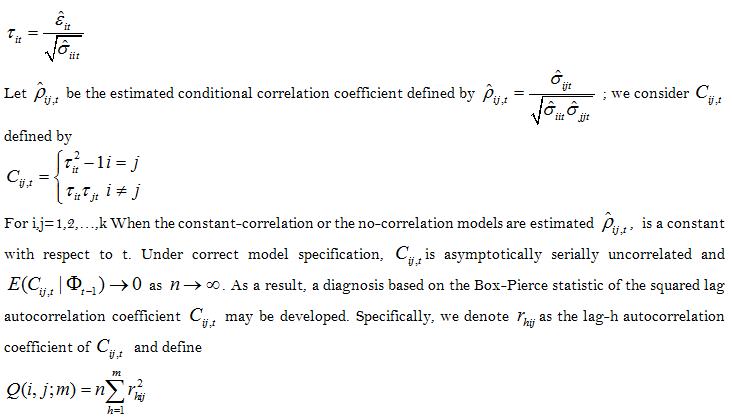
If the multivariate conditional heteroscedasticity model fits the historical data,![]() should be serially uncorrelated for i and j. Model insufficiency would be indicated by a high value of Q. In the empirical literature, the Test has been frequently used to diagnose both univariate and multivariate conditional heteroscedasticity models. Tse and Tsui (1999).
should be serially uncorrelated for i and j. Model insufficiency would be indicated by a high value of Q. In the empirical literature, the Test has been frequently used to diagnose both univariate and multivariate conditional heteroscedasticity models. Tse and Tsui (1999).
3.6. Wald Test
Unrestricted regression is used in this test. The Wald statistic analyzes how near the unconstrained estimates are to meeting the null hypothesis's constraints. If the constraints are reasonable, the unrestrained estimates should come close to meeting them.
Refer to Return Equation 5 to test Return Spillovers among Bitcoin, currencies from developed countries, and currencies from emerging countries. The following hypotheses can be tested by using Wald Test:
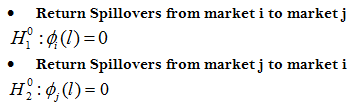
Refer to the multivariate volatility model Equation 8 for (N = 2). The following hypotheses are of interest to test the volatility spillover effects among Bitcoin, currencies from developed countries, and currencies from emerging countries by Wald test. The following hypotheses can be tested.
- Volatility Spillovers between market i and market j
- Spillovers between market i and market j
Note: i = USD/BTC and j = USD/EUR; USD/CNH; USD/IDR
4. Results and Discussions
4.1. Data
We used Bitcoin, two exchange rates from developed countries/regions (USD/EUR & USD/CNH), and two exchange rates from emerging countries (USD/MAD & USD/IDR).
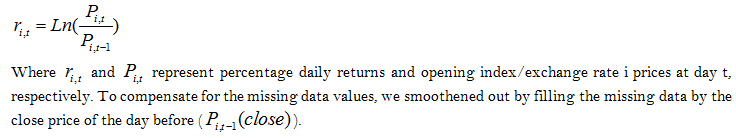
We chose bitcoin as a proxy of cryptocurrency as it proves its dominance among other cryptocurrencies (Yi, Xu, & Wang, 2018), The data is collected over the sample period from 01 January 2015 until 31 December 2018, giving a total of 1461-time series observations to investigate the differences in linkage among Bitcoin, developed country’s currency and emerging country’s currency. Continuously compounded daily returns are calculated based on the following logarithmic filter:
4.2. Descriptive Statistics
The characteristics of our data set presented in Table 1, USD/BTC offered on average the highest return (17,0546%) compared to the other currencies that only offered (0,3639% for USD/EUR, 0,6848% for USD/CNH, 0,3651% for USD/MAD and 0,1023% for USD/IDR) in one hand, on the other hand, Bitcoin showed comparatively higher risk (Std.Dev 4.132702) compared to other stock indexes rates (Std.Dev 0.472538 for USD/EUR, Std.Dev 0.242615 for USD/CNH, Std.Dev 0.316907 for USD/MAD and Std.Dev 0.314198 for USD/IDR ). Non-normality and fat tails are also suggested by the data in Table 1. The Jarque-Bera Lagrange Multiplier Test failed to reject the null hypothesis that the data were normally distributed, with p-values of 0 for all the time series above. The Ljung-Box statistics detected significant autocorrelation in all cases. USD/EUR returns did not show a significant autocorrelation for Q(10), but its other lags are significant. The ADF and PP unit root tests are used to determine if the return series is stationary. The unit root Null Hypothesis is rejected, implying that the return series under investigation are stationary processes. Furthermore, the LM test for ARCH effects is calculated to support the GARCH model structure. The relevant F-statistics and Engle’s LM tests were significant in all return series with the exception of lag 10 in USD/BTC and USD/EUR LM test. However, it was not the case for the bitcoin test’s sixth lag and seventh lag and USD/EUR test’s fourth and fifth lags, thus GARCH was chosen as an acceptable model for this investigation since it supports the occurrence of ARCH effects.
| Data | |||||
| Descriptive stat | USD-BTC |
USD-EUR |
USD-CNH |
USD-MAD |
USD-IDR |
| Mean | 0.170546 |
0.003639 |
0.006848 |
0.003651 |
0.010230 |
| Median | 0.175965 |
0.000000 |
0.000000 |
0.000000 |
0.000000 |
| Maximum | 23.72200 |
2.430363 |
2.761291 |
1.692403 |
1.587482 |
| Minimum | -34.54095 |
-2.995268 |
-1.498392 |
-2.095637 |
-3.280184 |
| Std. Dev. | 4.132702 |
0.472538 |
0.242615 |
0.316907 |
0.314198 |
| Skewness | -0.581551 |
-0.114031 |
0.359718 |
-0.050945 |
-1.539452 |
| Kurtosis | 10.57846 |
7.179935 |
19.47888 |
7.978226 |
21.10656 |
| Jarque-Bera | 3576.136 |
1066.035 |
16550.99 |
1508.248 |
20520.74 |
| (Prob.) | 0.000000 |
0.000000 |
0.000000 |
0.000000 |
0.000000 |
| Q(10) | 19.628 |
12.694 |
16.716 |
16.805 |
23.791 |
| (Prob.) | 0.033 |
0.241 |
0.081 |
0.079 |
0.008 |
| ADF Test | -39.64077 |
-37.87227 |
-37.67601 |
-38.18082 |
-34.94068 |
| (Prob.) | 0.000000 |
0.000000 |
0.000000 |
0.000000 |
0.000000 |
| PP Test | -41.09201 |
-37.87232 |
-37.68775 |
-38.18082 |
-35.20356 |
| (Prob.) | 0.000000 |
0.000000 |
0.000000 |
0.000000 |
0.000000 |
| ARCH LM (9) F-Stat | 1.525468 |
1.248758 |
1.784922 |
1.713224 |
2.476143 |
| (Prob.) | 0.1335 |
0.2608 |
0.0666 |
0.0811 |
0.0084 |
| ARCH LM (9) Obs*R² | 13.69423 |
11.22929 |
15.99785 |
15.36200 |
22.09933 |
| (Prob.) | 0.1336 |
0.2603 |
0.0669 |
0.0815 |
0.0086 |
Note: |
5. Results and Discussion
As the study focused on the differences in mean and volatility Shock transmissions among Bitcoin, exchange rates from developed countries/regions, and exchange rates from emerging countries, four VaR-DVECH bivariate models were estimated using Eviews program version 10. Each model was calibrated with daily Bitcoin returns and exchange rate returns.
- The difference in the mean and the volatility linkages among Bitcoin, exchange rates from developed countries, and those from emerging markets:
The results shown in Table 2 demonstrate no cross mean spillovers between Bitcoin and USD/EUR. However, Bitcoin’s returns were influenced by USD/CNH return’s ninth lag, USD/MAD return’s third lag, and USD/IDR return’s first lag, since (φUSD/CNH (9), φUSD/MAD(3) and φUSD/IDR(1)) were statistically significant.
As for cross volatility spillovers (refer to Equation 8 and Table 3, the results showed that there were no cross volatility spillovers in all the equations except for Bitcoin-USD/CNH equation since A(1,2) in this equation was statistically significant, which means that Bitcoin’s and USD/CNH past innovations were influenced by one another.
| Mean Systems | ||||
| Coefficients | BIT-USD/EUR |
BIT-USD/CNH |
BIT-USD/MAD |
BIT-USD/IDR |
| Φ0,Bitcoin | 0.233173*** |
0.248062*** |
0.227475*** |
0.227788*** |
| Φ0,USD/EUR | -0.001324 |
- |
- |
- |
| Φ0,USD/CNH | - |
0.004790 |
- |
- |
| Φ0,USD/MAD | - |
- |
-0.005526 |
- |
| Φ0,USD/IDR | - |
- |
- |
0.006054 |
| φBitcoin(6) | 0.001870 |
-0.001443 |
- |
0.001987 |
| φUSD/EUR(4) | 0.034926 |
- |
- |
- |
| φUSD/EUR(12) | -0.039361 |
- |
- |
- |
| φUSD/CNH (1) | - |
0.013006 |
- |
- |
| φUSD/CNH (5) | - |
-0.041141 |
- |
- |
| φUSD/CNH (9) | - |
0.061662** |
- |
- |
| φUSD/MAD(3) | - |
- |
-0.053098** |
- |
| φUSD/MAD(4) | - |
- |
0.011386 |
- |
| φUSD/IDR(1) | - |
- |
- |
0.106109*** |
Note: |
In terms of cross-volatility persistence, the results shown in Table 3 also indicated that B(1,2) was significant in all the equations except for BIT-USD/IDR, which means that (Bitcoin & USD/EUR), (Bitcoin & USD/CNH), and (Bitcoin & USD/MAD) shared bidirectional relationships in terms of cross volatility persistence.
Note: the results above were confirmed by the Wald Test see Table 4.
| Variance Systems | ||||
| DVECH Coefficients | BIT-USD/EUR |
BIT-USD/CNH |
BIT-USD/MAD |
BIT-USD/IDR |
| M(1,1) | 0.612739*** |
0.555495*** |
0.537583*** |
0.546250*** |
| M(1,2) | -0.004587 |
0.001431 |
-0.000352 |
0.006881 |
| M(2,2) | 0.000344** |
0.004281*** |
0.000128*** |
0.000802*** |
| A(1,1) | 0.123475*** |
0.114466*** |
0.120950*** |
0.118984*** |
| A(1,2) | 0.001482 |
-0.056486*** |
-0.006239 |
0.003900 |
| A(2,2) | 0.009554*** |
0.034656*** |
0.002863** |
0.093448*** |
| B(1,1) | 0.849189*** |
0.860519*** |
0.858984*** |
0.858984*** |
| B(1,2) | 0.881232*** |
0.806417*** |
0.977542*** |
0.627997 |
| B(2,2) | 0.988284*** |
0.892074*** |
0.994615*** |
0.909112*** |
Note: |
| Wald Test Hypothesis | ||||
| Samples | ||||
| BIT-USD/EUR | 0.678054 |
4.440534 |
59.36305*** |
71.34097*** |
| BIT-USD/CNH | 0.864181 |
6.732085* |
86.45647*** |
101.9535*** |
| BIT-USD/MAD | - |
5.473250* |
6300.759*** |
6323.911*** |
| BIT-USD/IDR | 2.403496 |
13.04667*** |
0.111983 |
15.73580*** |
Note: |
Overall, the findings revealed that neither country growth nor policymakers could have an impact on the nature of the relationship between their respective currency rates and cryptocurrencies. Even though Morocco is a third world country that prohibits the usage or purchase of cryptocurrencies, USD/MAD returns impact USD/BTC returns. In addition, the Moroccan exchange rate and Bitcoin have a bidirectional volatility persistence link. The European region, on the other hand, does not prohibit the usage of cryptocurrencies; nonetheless, there was no cross mean spillover link between USD/EUR and USD/BTC, nor was there a cross-volatility persistence relationship. The hypothesis that bitcoin and exchange rates from developed nations where the usage of cryptocurrencies is permitted might explain these outcomes. Speculators, risk managers, and portfolio hedgers coupled Bitcoin and emerging-market exchange rates in attempt to diversify their portfolios.
5.1. Residual Diagnostic
Finally, the portmanteau test see Table 5 using standard residuals only showed weak evidence of autocorrelation in the standardized residuals in (Bitcoin – USD/CNH) from lag 6 to 7 and from lag 9 to 11 based on these results, we can safely assume that our mean equations were correctly specified.
Q-Stat for each sample |
||||
Lags |
BIT-USD/EUR |
BIT-USD/CNH |
BIT-USD/MAD |
BIT-USD/IDR |
1 |
4.931825 |
9.408731* |
6.526397 |
4.051917 |
2 |
8.599118 |
13.74501* |
10.30315 |
6.713698 |
3 |
17.35626 |
16.08077 |
16.80415 |
11.51277 |
4 |
21.89043 |
21.83604 |
24.40428* |
15.55513 |
5 |
24.54709 |
26.45821 |
27.14492 |
19.23421 |
6 |
30.26992 |
31.79043 |
33.05771 |
27.17896 |
7 |
33.28569 |
34.38143 |
36.99813 |
32.86189 |
8 |
33.83274 |
36.13763 |
38.23852 |
35.60941 |
9 |
37.99877 |
38.02257 |
43.19052 |
38.49292 |
10 |
42.74523 |
44.02685 |
47.85109 |
43.99237 |
11 |
44.46186 |
48.0302 |
50.56836 |
46.75357 |
12 |
54.36554 |
51.37984 |
57.51094 |
47.60944 |
Note: |
6. Conclusion
Our investigation is motivated by the scarce literature on the return and volatility Shocktransmissions between Bitcoin and a selection of exchange rates, namely, USD/EUR, USD/CNH, USD/MAD, and USD/IDR. This study examines the differences in linkages between Bitcoin and currencies from both emerging countries and developed ones. This investigation has led to subsequent pieces of evidence. Firstly, the empirical results provide convincing findings for the return spillover effect in a unidirectional way, from all the exchange rates except for USD/EUR to Bitcoin. One possible conclusion that could be drawn is that profits from the more regular forex markets are transferred to the unregulated cryptocurrency market, resulting in establishing relationships in terms of cross-returns spillovers between exchange rates from emerging countries and Bitcoin despite the cryptocurrency ban in those nations.
Second, the results show the existence of bidirectional cross-volatility persistence effects between Bitcoin and all other exchange rates, except for USD/IDR. In contrast, only USD/CNH and Bitcoin have a bidirectional relationship in terms of cross volatility spillover. Because cryptocurrencies are interconnected and exhibit comparable connectedness patterns to other exchange rates, our findings support the idea that they may be considered as a new financial asset class. The findings also show that we cannot determine the degree of Bitcoin integration solely on a country's technical advancements and market openness.
Because Bitcoin has shown signs of moderate integration with most of the asset classes studied, investors and fund managers should exercise caution when combining Bitcoin with most of the asset classes, as several previous studies have shown (Baek & Elbeck, 2015, Baur, Hong, & Lee, 2018, Bouri et al., 2017a, Bouri et al., 2017b, Briere et al., 2015, and Ji et al., 2017) . Market players should consider market circumstances while doing so. When making Bitcoin investing selections, they should distinguish between global, emerging, and Chinese markets
References
Ali, R., Barrdear, J., Clews, R., & Southgate, J. (2014). The economics of digital currencies. Bank of England Quarterly Bulletin, 54(3), 276-286.
Aslanidis, N., Fernandez Bariviera, A., & Martínez-Ibañez, O. (2019). An analysis of cryptocurrencies conditional cross correlations. Finance Research Letters, 31(C), 130-137. Available at: https://doi.org/10.1016/j.frl.2019.04.019.
Baek, C., & Elbeck, M. (2015). Bitcoins as an investment or speculative vehicle? A first look. Applied Economics Letters, 22(1), 30-34. Available at: https://doi.org/10.1080/13504851.2014.916379.
Baur, D. G., Hong, K., & Lee, A. (2018). Bitcoin: Medium of exchange or speculative assets? Journal of International Financial Markets, Institutions and Money, 54(C), 177-189.
Bollerslev, T., Engle, R. F., & Wooldridge, J. M. (1988). A capital asset pricing model with time-varying covariances. Journal of Political Economy, 96(1), 116-131. Available at: https://doi.org/10.1086/261527.
Bouri, E., Das, M., Gupta, R., & Roubaud, D. (2018). Spillovers between bitcoin and other assets during bear and bull markets. Applied Economics, 50(55), 5935-5949. Available at: https://doi.org/10.1080/00036846.2018.1488075.
Bouri, E., Gupta, R., Tiwari, A., & Roubaud, D. (2017a). Does bitcoin hedge global uncertainty? Evidence from wavelet-based quantile-in-quantile regressions. Finance Research Letters, 23(C), 87-95. Available at: https://doi.org/10.1016/j.frl.2017.02.009.
Bouri, E., Jalkh, N., Molnár, P., & Roubaud, D. (2017b). Bitcoin for energy commodities before and after the December 2013 crash: diversifier, hedge or safe haven? Applied Economics, 49(50), 5063-5073.
Bouri, E., Shahzad, S. J. H., & Roubaud, D. (2019). Cryptocurrencies as hedges and safe-havens for US equity sectors. The Quarterly Review of Economics and Finance, 75(C), 294-307. Available at: https://doi.org/10.1016/j.qref.2019.05.001.
Box, G. E., & Pierce, D. A. (1970). Distribution of residual autocorrelations in autoregressive-integrated moving average time series models. Journal of the American Statistical Association, 65(332), 1509-1526. Available at: https://doi.org/10.1080/01621459.1970.10481180.
Briere, M., Oosterlinck, K., & Szafarz, A. (2015). Virtual currency, tangible return: Portfolio diversification with bitcoin. Journal of Asset Management, 16(6), 365-373. Available at: https://doi.org/10.1057/jam.2015.5.
Chaim, P., & Laurini, M. (2018). Volatility and return jumps in bitcoin. Economics Letters, 173(C), 158-163. Available at: https://doi.org/10.1016/j.econlet.2018.10.011.
Corbet, S., Lucey, B., Urquhart, A., & Yarovaya, L. (2019). Cryptocurrencies as a financial asset: A systematic analysis. International Review of Financial Analysis, 62, 182–199. Available at: https://doi.org/10.1016/j.irfa.2018.09.003.
Demir, E., Gozgor, G., Lau, C. K. M., & Vigne, S. A. (2018). Does economic policy uncertainty predict the Bitcoin returns? An empirical investigation. Finance Research Letters, 26, 145-149. Available at: https://doi.org/10.1016/j.frl.2018.01.005.
Dyhrberg, A. H. (2016a). Bitcoin, gold and the dollar–A GARCH volatility analysis. Finance Research Letters, 16, 85-92. Available at: https://doi.org/10.1016/j.frl.2015.10.008.
Dyhrberg, A. H. (2016b). Hedging capabilities of bitcoin. Is it the virtual gold? Finance Research Letters, 16, 139-144. Available at: https://doi.org/10.1016/j.frl.2015.10.025.
Engle, R. (2002). Dynamic conditional correlation: A simple class of multivariate generalized autoregressive conditional heteroskedasticity models. Journal of Business & Economic Statistics, 20(3), 339-350. Available at: https://doi.org/10.1198/073500102288618487.
European Central Bank. (2012). Virtual currency schemes. October, 1–55.
Gajardo, G., Kristjanpoller, W. D., & Minutolo, M. (2018). Does bitcoin exhibit the same asymmetric multifractal cross-correlations with crude oil, gold and DJIA as the Euro, Great British Pound and Yen? Chaos, Solitons & Fractals, 109(C), 195-205. Available at: https://doi.org/10.1016/j.chaos.2018.02.029.
Guesmi, K., Saadi, S., Abid, I., & Ftiti, Z. (2019). Portfolio diversification with virtual currency: Evidence from bitcoin. International Review of Financial Analysis, 63(C), 431-437. Available at: https://doi.org/10.1016/j.irfa.2018.03.004.
Halaburda, H., & Gandal, N. (2014). Competition in the cryptocurrency market. SSRN Working Paper 2506463.
Han, H., Linton, O., Oka, T., & Whang, Y.-J. (2016). The cross-quantilogram: Measuring quantile dependence and testing directional predictability between time series. Journal of Econometrics, 193(1), 251-270. Available at: https://doi.org/10.1016/j.jeconom.2016.03.001.
Ji, Q., Bouri, E., Gupta, R., & Roubaud, D. (2017). Network causality structures among bitcoin and other financial assets: A directed acyclic graph approach. Department of Economics, University of Pretoria, Working Paper No. 201729.
Ji, Q., Bouri, E., Kristoufek, L., & Lucey, B. (2019). Realised volatility connectedness among Bitcoin exchange markets. Finance Research Letters, 38, 101391. Available at: https://doi.org/10.1016/j.frl.2019.101391.
Kyriazis, Ν. A., & Prassa, P. (2019). Which cryptocurrencies are mostly traded in distressed times? Journal of Risk and Financial Management, 12(3), 1-12. Available at: https://doi.org/10.3390/jrfm12030135.
Li, X., & Wang, C. A. (2017). The technology and economic determinants of cryptocurrency exchange rates. Decision Support Systems, 95(C), 49-60. Available at: https://doi.org/10.1016/j.dss.2016.12.001.
Liu, J., & Serletis, A. (2019). Volatility in the cryptocurrency market. Open Economies Review, 30(4), 779-811. Available at: https://doi.org/10.1007/s11079-019-09547-5.
Luis, P., de la Fuente, G., & Perote, J. (2019). The drivers of bitcoin demand: A short and long-run analysis. International Review of Financial Analysis, 62(C), 21-34. Available at: https://doi.org/10.1016/j.irfa.2019.01.006.
Reyes, C. L. (2016). Moving beyond bitcoin to an endogenous theory of decentralized ledger technology regulation: An initial proposal. Villanova Law Review, 61(1), 191.
Terasvirta, T., Tjostheim, D., & Granger, C. W. J. (2010). Modelling nonlinear economic time series (pp. 432): Oxford University Press.
Trabelsi, N. (2018). Are there any volatility spill-over effects among cryptocurrencies and widely traded asset classes? Journal of Risk and Financial Management, 11(4), 1-17.
Tse, Y. K., & Tsui, A. K. (1999). A note on diagnosing multivariate conditional heteroscedasticity models. Journal of Time Series Analysis, 20(6), 679-691. Available at: https://doi.org/10.1111/1467-9892.00166.
Yi, S., Xu, Z., & Wang, G.-J. (2018). Volatility connectedness in the cryptocurrency market: Is bitcoin a dominant cryptocurrency? International Review of Financial Analysis, Elsevier, 60(C), 98-114. Available at: https://doi.org/10.1016/j.irfa.2018.08.012.
Zhang, W., Wang, P., Li, X., & Shen, D. (2018). The inefficiency of cryptocurrency and its cross-correlation with dow jones industrial average. Physica A: Statistical Mechanics and Its Applications, 510, 658–670. Available at: https://doi.org/10.1016/j.physa.2018.07.032.