What Determines the Effectiveness of a Currency: A Composite Index
Emmanouil Karakostas
Department of International and European Studies, School of Economics, Business and International Studies, University of Piraeus, Greece. |
AbstractThe variety and diversity of currencies forms a significant aspect of the international political economy and especially the global economic relations among countries. It can be said that the “language” of countries’ international economic activities is the variation displayed by their currencies. A plethora of papers has indicated a relationship between exchange rates and many facets of international economic relations, with a negative, positive, or even neutral link. Exchange rates can fluctuate due to exogenous events or due to endogenous choice. Whatever the cause, it is certain that exchange rate fluctuation can influence many features of a country’s economy. Specifically, exchange rates can affect macroeconomic variables, trade performance and others. So, what are the prerequisites that shape the relationship between a country’s exchange rates and its economic activities? These prerequisites include the international, political and economic aspects of a country. The combination of these factors is what shapes the country’s relative effectiveness and its “freedom” to use its currency to achieve its economic goals. The current paper shows that the combination of the international, political and economic aspects of a country is fundamental to its freedom to use its currency for this purpose. The methodology adopted is the creation of a Composite Index. |
Licensed: |
|
Keywords: JEL Classification |
|
Received: 13 December 2021 |
|
Funding: This study received no specific financial support. |
Competing Interests: The author declares that there are no conflicts of interests regarding the publication of this paper. |
1. Introduction
Every country has certain economic targets. The economic policies of countries are the means of achieving economic goals. What then is the role of exchange rates in the achievement of economic targets? One answer can be found in the problem of the “impossible trinity,” which declares that a country is able to simultaneously pursue only two (but not all) of the following three objectives: monetary independence, exchange rate stability and financial integration (Aizenman, Chinn, & Ito, 2013). Aizenman and Ito (2011) explain the benefits of each target in the “impossible trinity”. In particular, they argue that greater monetary independence is preferable for stabilizing the economy through monetary policy. Exchange rate stability on the other hand could bring about price stability, thereby promoting investment and international trade. Finally, financial liberalization could lead to economic growth by mitigating information asymmetry, supplementing domestic savings, and facilitating the transfer of technological know-how. So, as Broz and Frieden (2001) argue, there are actually two types of national decisions relating to currency. The first is the decision about the regime under which the currency is managed (fixed or floating) and the other concerns the level of the currency (strong or weak). The choice of the regime and the choice of the level of the currency each serve certain objectives. Regarding the regime, the choice is between monetary stability and predictability on the one hand or monetary independence and flexibility on the other, and concerning the level of the currency, the choice is between increased purchasing power (a strong – appreciated – currency increases national purchasing power) and the development of the competitive position of domestic producers (a weak currency exchange rate improves their competitiveness) (Frieden, 2015). The choice of the regime and level of the currency is one crucial factor in the achievement of economic objectives.
The assumption of this paper is that the choice of the level of the currency and the choice of the regime are actually the outcome of a combination of a country’s three factors. The three factors are the following: The first factor is the international factor – especially military safety, the influence on global political institutions and the strength of economic organizations. The second factor is the political factor – specifically political stability, social characteristics and macroeconomic stability. The third factor is the economic factor – particularly the total productivity, the level of dependence on or control over energy and intermediate goods and the structure of the market. The combination of the three factors provides the country with the appropriate level of “safety” – international factors, “stability” – political factors, and “ability” – economic factors. The three pillars contribute to the relative “effectiveness” a country has regarding its use of currency to achieve its targets. The exchange rate is an economic “tool”, or rather an aspect of a country’s economic policy. The greater a country’s “effectiveness”, the more effective and easier is its use of currency. If a country possesses “minor effectiveness”, it is obligated to devalue its currency or to use another economic policy – which may perhaps worsen its economy – in order to achieve an economic objective. The relative effectiveness does not imply an overvalued currency, but instead a currency that can be easily manipulated, without hurting the real economy, to accomplish the continuously changing economic objectives in a world with varying economic, political and global circumstances.
This paper aims to construct a composite index that can explain the main factors that determine currency effectiveness. The remainder of this paper is structured as follows:
In the second section, the methodology of the composite index is outlined. The third section presents the theoretical framework of the index. The fourth section describes the normalization and aggregation of the indicators. In the fifth section the validation of the index is discussed. The final section concludes. This research is based on the development of a composite index that explains the relative strength of currencies.
2. Methodology
The primary objective of the study is to construct a Currency Effectiveness Index that measures the dimensions of the categorization of currencies according to a quantitative methodology1 . The index to be created is a composite indicator.2 Nardo et al. (2005) define a composite index. In particular, they state:
“... a composite indicator is the mathematical combination of individual indicators representing different dimensions of a concept, the description of which is the objective of the analysis ...”
Freudenberg (2003) claims that composite indicators are an instrument that is increasingly applied to compare countries' performance at specific levels. Use cases include competitiveness, globalization, innovation, etc. The construction of the composite index will follow the OECD Handbook on Constructing Composite Indicators (OECD, 2008), which is an appropriate reference for methodological proposals. The Normalization 3 method that is used to build the index is the Min-Max Normalization Method. 4 According to OECD (2008):
“Min-Max normalizes the indicators so that they have the same range [0,1] by subtracting the minimum value and dividing by the range of the index values …”
The Min-Max Normalization equation is as follows:
Equation 1 presents the Min-Max Normalization, where Value is the selected value, Min is the smallest of the sample values and Max is the highest of the sample values. The method of normalization and concentration used by the World Economic Forum to construct the Global Competitiveness Report is used. In particular, the World Economic Forum applies the Min-Max method (ranging from 0 to 100) for the normalization of each sub-index. According to Schwab (2019), each sub-index of the World Economic Forum is upgraded 5 to the following formula:
Equation 2 captures the aforementioned method, where Valuei,c is the value of sub-index i of country c, the worst performance (wpi) is the lowest acceptable value for sub-index i and frontieri corresponds to the highest value (and best possible result) for sub-index i.
According to Ochel and Röhn (2006), the Min-Max Normalization method is employed by the Fraser Institute: Economic Freedom of the World Index (EFW index) and the World Economic Forum (WEF) Growth Competitiveness Index (GCI).
Regarding the concentration6 stage, the procedure used by the World Economic Forum is followed. In other words, we use the process of finding the average.7 The procedure is mentioned in the Global Competitiveness Report.
Talukder, Hipel, and Van Loon (2017) mention:
“Commonly applied aggregation options include additive aggregation (arithmetic mean), […] The arithmetic mean is a linear function. The normalized [….] indicators are summed to compute the arithmetic mean ...”
The formula for assessing arithmetic mean is the following:
According to Mazziotta and Pareto (2013), there is no common method for building a composite index, although they suggest four steps for structuring one. The first step is the definition of the phenomenon. The second step is the selection of a group of individual indicators. The third step is the normalization of the individual indicators. The final step is the aggregation of the normalized indicators. Our index consists of three (3) dimensions8 (International, Political and Economic), with nine (9) sub-categories that have been constructed out of a total of fifteen (15) indicators. The criteria for each indicator were based on an analysis of the previous literature. This formed the basis for the development of the composite index.
In order to accomplish this indicatively, the following currencies are used: the US Dollar ($), the English Pound (£), the Japanese Yen (¥), the Brazilian Real (R$). The function of the composite index is as follows: the higher the value of the index, the greater the effectiveness of the currency. In other words, there is a similar relationship. Τhe selected data are as up to date as possible and were selected based on availability. Figure 1. illustrates the function of the composite index.
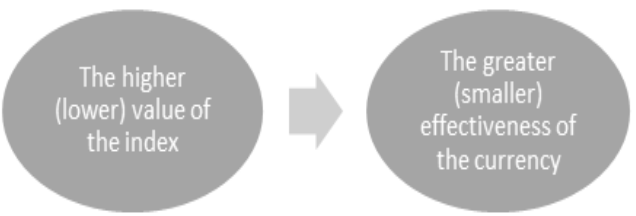
Figure 1. The function of the composite index.
To understand the function of the indicator more clearly, it will be compared with the Real Effective Exchange Rate.9 In particular, the values of the composite index will be compared with the standard deviation10 of the percentage change of the Real Effective Exchange Rate for the examined countries from year ago. The idea on which the comparison is based is that when a country has a high value in this composite index it implies that its trade competitiveness, i.e., its Real Effective Exchange Rate, does not fluctuate wildly. The choice to use the Real Effective Exchange Rate (REER) is made because it is considered the best means of measuring a country’s trade competitiveness (Santoya & Soutar, 2011). The comparison is as follows: the higher the value of the index, the smaller the standard deviation of the percentage change in the Real Effective Exchange Rate for the country under consideration. Figure 2. shows the comparison of the index and the REER.
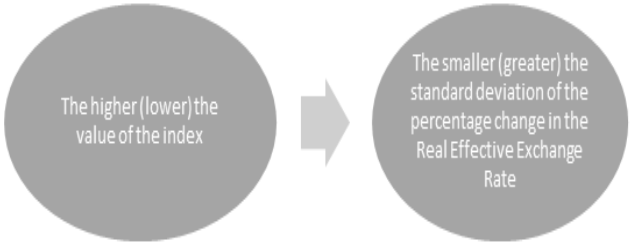
Figure 2. The comparison of the index and the real effective exchange rate.
The next section outlines the theoretical framework of the Currency Effectiveness Index.
3. The Theoretical Framework of the Currency Effectiveness Index
What are the determinants of international currency competition? According to Song (2014), there are four representative views of this matter. First is the Comprehensive Strength Theory, which states that currency competition is shaped by issues that create comprehensive strength, such as trade, financial markets, financial institutions, political status etc. Second is the Currency Characteristics Theory, which states that continually increasing trading suitability, lower transaction losses and more fixed value make the currency more widespread. Third is the Geopolitical Theory, which states that colonial wars or alliances can increase the competitiveness of a currency. The final one is the Scale Theory, which states that people are prone to select an international currency that is currently broadly used. This paper will try to achieve a more holistic analysis of currency competition by constructing a Composite Index. The choice of the indicators is crucial, because is the most crucial step of creating the index.
First, the “safety” factor is critical. Τhe currency could become a tool of “soft” power (Vuving, 2009). Economic power is a hallmark of “hard” power (Pustovitovskij & Kremer, 2011). Military security and military alliances help promote international currencies, such as the dollar (Eichengreen, Mehl, & Chitu, 2017). Also, the country that dominates the global currency at the same time holds a dominant position in the international financial institutions (Cao, 2016). Moreover, participation in international organizations and the simultaneous imposition of sanctions in the event of an economic conflict is an important criterion (Whalley, 2009). Membership in the G7 is essential in terms of a country’s monetary affairs (Ocampo, 2017). The occupation of international reserves may be an element of a state exerting international economic power (Laffaye, Lavopa, & Llana, 2013). However, it can be argued that economic power is also a criterion of “soft” power (Wang & Lu, 2008). It can be said that the characteristics of both “hard” power and “soft” power have an effect on the development of appropriate “security” for a currency. For example, as Cevik, Harris, and Yilmaz (2017) mention, the volatility of exchange rates depends on factors that determine the “soft” power of a country. The military power of a state is one of the factors that defines the role of a currency in the international system (Efstathiou & Papadia, 2018). Nuclear power gives its holder more diplomatic power, specifically increased international bargaining power, which results in political and economic profit (Van Der Meer, 2016). The naval power of the USA brought about the global spread of free trade and open markets after the fall of the Soviet Union, and the freedom of the seas is guaranteed mainly by US naval power (Cropsey & McGrath, 2018). Global political and economic institutions are very important because they offer aid and essential solutions to international problems prompted by globalization and because of their role in the evolving monetary system, like their role in the IMF (Wait & Thibane, 2015). The percentage of the quotas is significant in terms of the IMF because multinational organizations like IMF are subject to the political pressure and influence of their most powerful members (Thacker, 1999). The strength of economic organizations is crucial among the international factors. According to Lim (2006), a well-developed financial system raises the appeal of the domestic currency. Moreover, another economic characteristic of a global currency is liquidity (Chey, 2013). The choice of the financial development index is due to the importance of financial development. The financial crisis of 2008 demonstrated the costs of a defenseless financial sector to financial development and economic outcomes (World Bank, 2019).
Second, the “stability” factor is also essential. The reasons that led to our choice of political actors are their influence on stability in both the political and the macroeconomic aspects, which are important for a country’s currency. Studies such as Alesina, Ozler, Roubini, and Swagel (1996), Ali, Hashmi, and Hassan (2013), and Alesina and Perotti (1993) have shown that political instability and the credibility of the political system both have a significant impact on a country’s investor behavior. Bahmani-Oskooee and Nasir (2002) have shown that political corruption leads to undervalued exchange rates. Moreover, Steinberg and Walter (2013) have shown that many political factors influence a state's exchange rate policy. Kazi, Quaosar, and Nandi (2013) have shown that political instability affects the currency. Rodriguez (2016) has shown that attributes of political institutions, political potency and credibility have a serious effect on a country’s exchange rate policy. The central authorities of a state can stabilize its currency to promote the country’s international economic growth, along with other goals such as trade costs and foreign investment (Frieden, 2017).
The effectiveness of the government is vital. By improving government efficiency, economic growth and financial development can be promoted (Hauner & Kyobe, 2008). According to Mauro (1997), corruption could lead to multiple exchange rate practices with consequences for investment and economic growth. Social characteristics also play a significant role; one example is the likely positive impact of devaluation in countries with mostly rural areas, and the probable negative impact in countries with mostly urban areas (Gillingham, 2008). Social globalization can lead to cultural proximity, which can in turn affect economic and financial results (Du, Yu, & Yu, 2017).
Gross national income per capita is a human development value and can describe the known positive cross-sectional connection between relative price level and relative per capita income level (Cheung, Chinn, & Nong, 2017). Macroeconomic stability is another very important factor. Among other issues that could cause currency crises are macroeconomic fundamentals such as money or domestic credit growth, the fiscal deficit and others (Glick & Hutchison, 2011). According to Ha, Stocker, and Yilmazkuday (2019), currency depreciation linked with monetary assistance is accompanied by major increases in inflation. Exchange rates account for more growth in developing economies, and less in advanced economies (Habib, Mileva, & Stracca, 2016).
Thirdly, the “ability” factor is crucial. The use of the exchange rate as an economic policy tool to achieve economic growth is mentioned by Eichengreen (2008). Studies such as Aguirre and Calderon (2005), Di Nino, Eichengreen, and Sbracia (2011), Farrant and Peersman (2006), Rodrik (2008), and Dollar (1992) have all dealt with the role of the exchange rate in economic growth.
The characteristics of an economy play an important part in the choice of an appropriate exchange rate regime. Studies such as Mundell (1961), Dreyer (1978), Heller (1978), Fleming (1973), McKinnon (1963), Kenen (1969), and Savvides (1990) have shown that a country's productive potential or features provide the criteria for choosing the exchange rate. Productivity plays a major role. When production reacts to the price spur and moves towards the tradable sector, the overall productivity in the economy rises (Adebayo, 2020; Mbaye, 2012; Nuhu, 2021).
According to Cantwell (2003), innovation increases the total size of world trade because increased productivity growth is related to a rising share of world trade, by way of a growth of exports which leads to a growth of imports through the consequent rise in the value of the domestic currency. According to Guichard, Cheung, and Brézillon (2009), some of the great advanced economies, such as the USA and UK, owe their evolution of competitiveness to exchange rates.
Oil prices are the main cause of exchange rate movement, and a strong link between the two has been demonstrated (Chen & Chen, 2007). Dotsey and Duarte (2008) refer to the significant role of non-traded goods in exchange rate fluctuations. The degree to which an organization reacts to changes in the exchange rate depends on its market share (Auer & Schoenle, 2012). Because entrepreneurship is affected by economic freedom, among others things, the monetary system can influence business creation (Bédard, 2016). Figure 3. shows the theoretical framework of the Currency Effectiveness Index.
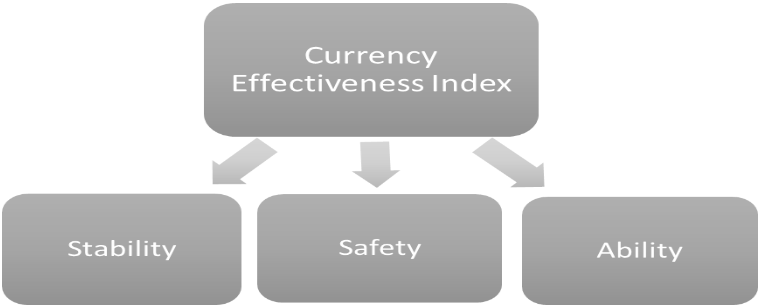
Figure 3. The theoretical framework of the currency effectiveness index.
In the next section, the indicators are normalized to quantify the Currency Effectiveness Index.
4. The Normalization and Aggregation of the Indicators of the Currency Effectiveness Index
In this section the indicators of the Currency Effectiveness Index are normalized. The normalization method employed is the Min-Max method (the method the World Economic Forum uses to construct the Global Competitiveness Report).
Table 1. shows the values of the chosen indicators for the United States, Japan, United Kingdom, and Brazil.
To facilitate the creation of the Currency Effectiveness Index, the normalized values of the indicators are placed in the following table.
Table 2 shows the normalized Values of the Indicators of the Currency Effectiveness Index for the United States, Japan, United Kingdom, Brazil.
The aggregation method is an additive method – the arithmetic mean (the method the World Economic Forum uses to construct the Global Competitiveness Report). Table 3. shows the aggregation of the indicators of the Currency Effectiveness Index of the United States, Japan, United Kingdom, and Brazil.
The Figure 4., visualizes the results of the Currency Effectiveness Index of the selected countries.
| Indicators | USA |
Japan |
UK |
Brazil |
| Number of nuclear warheads, 2020* | 5.800 |
0 |
215 |
0 |
| Navy Fleet Strength by Country (2021) ** | 490 |
155 |
88 |
112 |
| Percentage of Participation in Financing the IMF, 2021*** | 17.4 |
6.47 |
4.26 |
2.32 |
| Liquid liabilities, percent of GDP, 2017 | 75.2 |
220 |
141 |
84.5 |
| Financial Development Index, 2018**** | 0.9 |
0.89 |
0.90 |
0.63 |
| Government effectiveness index (-2.5 weak; 2.5 strong), 2019 | 1.49 |
1.59 |
1.44 |
-0.19 |
| Control of corruption (-2.5 weak; 2.5 strong), 2019 | 1.22 |
1.48 |
1.77 |
-0.33 |
| Social globalization index (0-100), 2018 | 86.5 |
79.9 |
89.1 |
62.2 |
| Human Development Index (0 - 1), 2020 | 0.92 |
0.91 |
0.93 |
0.76 |
| Gross Domestic Product, billions of U.S. dollars, 2019 | 21.4 |
5.1 |
2.8 |
1.8 |
| Innovation Index (0-100), 2020 | 60.6 |
52.7 |
59.8 |
31.9 |
| Oil production, thousand barrels per day, 2020 | 11.307 |
4 |
947 |
2.939 |
| World Intermediate Goods, Export Product Share (%) 2019***** | 17 |
16.4 |
23.9 |
28.1 |
| Economic freedom, overall index (0-100), 2021 | 75 |
74 |
78 |
53 |
| Business freedom index (0-100), 2021 | 83 |
86 |
94 |
58 |
| Source: Τhe Global Economy (2021); Statista (2021)*; GFP (2021)**; IMF. (2021a)*** and IMF. (2021b)****; WITS (2021)*****. |
| Indicators | USA |
Japan |
UK |
Brazil |
| Number of nuclear warheads, 2020 | 100 |
0 |
3.71 |
0 |
| Navy Fleet Strength by Country (2021) | 100 |
16.6 |
0 |
5.97 |
| Percentage of Participation in Financing the IMF, 2021 | 100 |
27.5 |
12.8 |
0 |
| Liquid liabilities, percent of GDP, 2017 | 100 |
96.3 |
100 |
0 |
| Financial Development Index, 2018 | 94.3 |
100 |
91.5 |
0 |
| Government effectiveness index (-2.5 weak; 2.5 strong), 2019 | 73.8 |
86.1 |
100 |
0 |
| Control of corruption (-2.5 weak; 2.5 strong), 2019 | 90.3 |
65.8 |
100 |
0 |
| Social globalization index (0-100), 2018 | 94.1 |
88.2 |
100 |
0 |
| Human Development Index (0 - 1), 2020 | 100 |
16.5 |
5.05 |
0 |
| Gross Domestic Product, billions of U.S. dollars, 2019 | 100 |
0 |
8.34 |
25.9 |
| Innovation index (0-100), 2020 | 5.02 |
0 |
64.2 |
100 |
| Oil production, thousand barrels per day, 2020 | 100 |
0 |
8.34 |
25.9 |
| World Intermediate Goods, Export Product Share (%) 2019 | 100 |
0 |
3.71 |
0 |
| Economic freedom, overall index (0-100), 2021 | 100 |
16.6 |
0 |
5.97 |
| Business freedom index (0-100), 2021 | 100 |
27.4 |
12.8 |
0 |
USA |
Japan |
UK |
Brazil |
|
| Average | 90.5 |
36.0 |
40.7 |
9.85 |
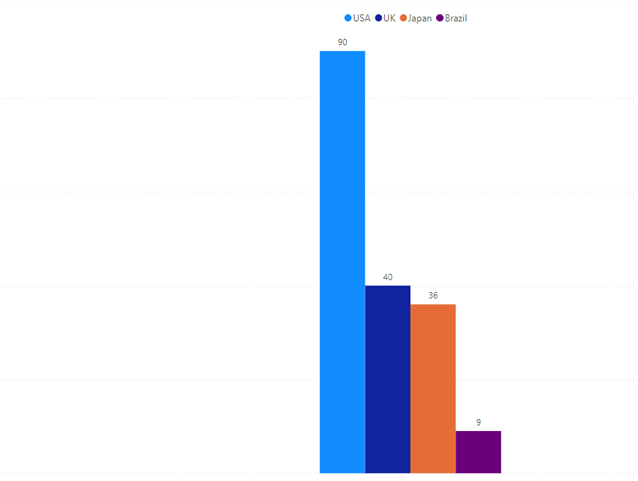
Figure 4. The presentation of the currency effectiveness index for the selected countries.
In the next section, the validation of the Currency Effectiveness Index is presented.
5. Validation and Presentation of the Currency Effectiveness Index
In this section the validation of the normalized indicators is presented. Table 4. shows the Real Broad Effective Exchange Rate percent change from previous year, on an annual basis that has not been seasonally adjusted, for the United States, Japan, United Kingdom, and Brazil for the period 2000-2020.
Year |
USA |
Japan |
UK |
Brazil |
2000 |
6.8 |
-6.8 |
-3.3 |
2.1 |
2001 |
3.6 |
-12.5 |
-0.2 |
-10.1 |
2002 |
-2.5 |
-1.9 |
0.4 |
-25.9 |
2003 |
-8.8 |
4.2 |
-3.7 |
22.1 |
2004 |
-4.4 |
-2.5 |
2.2 |
7.9 |
2005 |
3.8 |
-13.5 |
-2.8 |
26.3 |
2006 |
-4.4 |
-6.1 |
5.1 |
1.7 |
2007 |
-6.4 |
-4.5 |
-6.2 |
15.3 |
2008 |
6.1 |
28.9 |
-20.6 |
-18.2 |
2009 |
-6.1 |
-7.4 |
3.5 |
34.5 |
2010 |
-2.9 |
3 |
0.6 |
6.7 |
2011 |
0.5 |
2.6 |
1.9 |
-4.6 |
2012 |
-2 |
-10.8 |
3.3 |
-9.1 |
2013 |
1.9 |
-19.3 |
1.5 |
-5.7 |
2014 |
7 |
-8.3 |
3.2 |
-0.2 |
2015 |
9.8 |
3.7 |
4.4 |
-19.7 |
2016 |
4.9 |
6.5 |
-14.2 |
25 |
2017 |
-6.6 |
-3.4 |
0.5 |
-3.3 |
2018 |
4.4 |
2.9 |
-1.2 |
-7.7 |
2019 |
-0.4 |
1.5 |
4.0 |
-2.5 |
2020 |
-3.1 |
-1.1 |
-2.9 |
-20 |
| Source: FRED (2021). |
Table 5 shows the comparison between the values of the Composite Index and the standard deviation of the Real Effective Exchange Rate for the examined countries.
Value of the Composite Index |
Country |
Standard Deviation of the Percent Change from Previous Year - REER |
90.5 |
USA |
5.21 |
40.7 |
UK |
6.11 |
36 |
Japan |
9.55 |
9.85 |
Brazil |
16.0 |
We observe that the United States has the largest value of the index and the lowest value of the standard deviation. It is followed by the United Kingdom, and in the third place is Japan. In last place is Brazil. The Currency Effectiveness Index shows that the US dollar has the greatest value, which means that the US dollar has the most power. As Ogawa and Muto (2018) stated:
“… a position of the US dollar as a key currency has been still kept in the current international monetary system …”
The value of the currencies of the other developed countries follow: the Pound and Yen. A key question is why the English pound is appreciated over other currencies? According to Bootle and Mills (2016), the United Kingdom depends on high-tech exports – aerospace, aircraft engines, pharmaceuticals, motor vehicles and arms sales. The result is that the UK must maintain an appreciated exchange rate. But why is the Yen devaluated? Botman, Filho, and Lam (2013) argue that the significant depreciation that has occurred since late 2012 coincided with the emergence of “Abenomics”. Nonetheless, the Yen is broadly considered a “safe haven” currency. Ayres, Garcia, Guillen, and Kehoe (2019) cite the poor institutional framework of monetary authorities and Brazil's passive monetary policy as reasons behind the weakness of its currency.
Through the calculation of the indicators of the Currency Effectiveness Index, it can be said that the strength of the dollar is due to the high average of the chosen indicators, and secondly, that the countries that have high values are the most developed countries and their currency fluctuations are due to temporary changes in economic abilities or brief political disturbances. However, developing countries that experience permanent turbulence in their political stability and economic ability will have a weak currency and are doomed to devaluation.
6. Conclusion
Cohen (2015) states that currency internationalization improves the usefulness and effectiveness of money in all its roles. He goes on to describe monetary power.Monetary power has two aspects. The first is the power to “delay” (avoid the continuing cost of adjustment), and the second is the power to “deflect” (avoid the transitional cost of adjustment). A strong currency has more monetary power, and a strong currency is thus more effective.
What is the outcome of this research? Although the answer is not easy, it can be said that the currency competition is one important reality of the international economic system. Even if currency fluctuations occur to prevent an external shock or to implement a policy goal of the state’s authorities, the exchange rates are related to the degree of effectiveness of the currency. When a currency enjoys a large amount of safety, stability and ability, then the effectiveness of this currency is maintained.
In this study, a composite index was constructed to display the currency competition. If a country has a high value, this indicates that the country’s currency has the greatest power, meaning that its currency is more effective. However, when a country’s currency possesses great power, this does not mean that the currency will necessarily appreciate, but rather that the country has the freedom to fluctuate its currency whenever this is useful (mostly according to its trade capabilities). When a country does not have the freedom to use these methods, it is forced to constantly depreciate its currency.
One example is in the comparison between the case of two developed countries and the case of a developed country and an emerging country. In the first case, both the developed countries provide safety and stability, but one of the countries has more technological progress. Because this country will enhance its productivity, it will be free to fluctuate its currency either by depreciating it to increase exports or by appreciating it if the country is dependent on energy imports. In the second case, the developing country may not be able to provide safety, stability and ability, and as a result the developing country is doomed to depreciate its currency or be more vulnerable to international economic fluctuations. This example concerns the choice between depreciation or appreciation. Another example concerns the choice of regime. When a country experiences an increase in productivity and wants to secure markets for its products, but simultaneously has problems in its political and macroeconomic domestic environment, it will probably choose to peg its currency to secure the likely economic development. Finally, in the case that several countries have safety, stability and ability, the country that possesses the strongest factors will become the international currency of choice.
So, the main conclusion that can be drawn is that the combination of international and domestic safety, political and macroeconomic stability, and economic and productive ability provides the three crucial pillars of proper effectiveness. The transient and temporary fluctuations and instabilities of these pillars could explain the fluctuations between currencies, and the permanent and perpetual volatilities of the pillars could explain the ordered relationship among currencies. A country’s power to deflect and power to delay depend on the power of freedom of use – the effectiveness that a currency displays. We must not forget the fact that currency is essentially the reflection of a country's strength, and the strength of a country is expressed economically, politically and internationally. When a country can balance these areas and, above all, combine them optimally, then it will have an effective currency. An effective currency is one that can assist in the commercial activities of a state. The use of currency is an essential aspect of a country’s economy. A country's foreign trade and exchange rate policy are the key aspects of its international presence in the international economic system. A country's currency must therefore have the right capabilities to help boost a country's competitiveness. Therefore, in order for a currency to contribute to the competitiveness of a country, it must be as effective as possible. The pillars presented in this study show whether a currency is effective.
To conclude, this research has attempted to construct an index by choosing several indicators that describe the safety, stability and ability of four (4) currencies. This research provides a preliminary exploration of currency competition.References
Adebayo, T. S. (2020). Does the oil price influence the exchange rates in Nigeria? Empirical evidence from wavelet and causality approaches. Asian Journal of Economics and Empirical Research, 7(2), 126–135.Available at: https://doi.org/10.20448/journal.501.2020.72.126.135 .
Aguirre, A., & Calderon, C. (2005). Real exchange rate misalignments and economic performance. Central Bank of Chile Working Papers No. 315.
Aizenman, J., & Ito, H. (2011). The “Impossible Trinity,” the international monetary framework, and the pacific rim. Forthcoming. In: I. N. Kaur and N. Singh (Eds.), Handbook of the Economics of the Pacific Rim (pp. 1-34). Oxford, UK: Oxford University Press.
Aizenman, J., Chinn, M. D., & Ito, H. (2013). The “impossible trinity” hypothesis in an era of global imbalances: Measurement and testing. Review of International Economics, 21(3), 447-458.
Alesina, A., & Perotti, R. (1993). Income distribution, political instability, and investment. European Economic Review, 40(6), 1203-1228.
Alesina., A., Ozler, S., Roubini, N., & Swagel, P. (1996). Political instability and economic growth. Journal of Economic Growth, 1(2), 189-211.
Ali, S., Hashmi, S. H., & Hassan, A. (2013). Relationship between political instability and domestic private investment in Pakistan: A time series analysis. Pakistan Business Review, 15(1), 1-26.
Auer, R. A., & Schoenle, R. S. (2012). Market structure and exchange rate pass-through. Federal Reserve Bank of Dallas, Globalization and Monetary Policy Institute, Working Paper No. 130, October 2012.
Ayres, J., Garcia, M., Guillen, D., & Kehoe, P. (2019). The monetary and fiscal history of Brazil, 1960-2016. IDB Working Paper Series Nº IDB-WP-990, Inter-American Development Bank, April 2019.
Bahmani-Oskooee, M., & Nasir, A. (2002). Corruption, law and order, bureaucracy, and real exchange rate. Economic Development and Cultural Change, 50(4), 1021-1028.Available at: https://doi.org/10.1086/342534 .
Bédard, M. (2016). Entrepreneurship and economic freedom an analysis of empirical studies (pp. 1-40). Montreal: Montreal Economic Institute, November 2016.
Bootle, R., & Mills, J. (2016). The real sterling crisis. London: Academia Civitas.
Booysen, F. (2002). An overview and evaluation of composite indices of development. Social Indicators Research, 59(2), 115-151.
Botman, D., Filho, I., & Lam, W. R. (2013). The curious case of the yen as a safe haven currency: A forensic analysis. International Monetary Fund, No WP/13/228. November 2013.
Broz, J. L., & Frieden, J. A. (2001). The political economy of international monetary relations. Annual Review of Political Science, 4(1), 317-343.
Brunnermeier, M. K., James, H., & Landau, J. P. (2019). The digitalization of money. National Bureau of Economic Research, Working Paper No. 26300.
Cantwell, J. (2003). Innovation and competitiveness. Revised Version (August 2003) of Chapter 21 for Handbook of Innovation edited by J. Fagerberg, D.C. Mowery and R.R. Nelson: Forthcoming by John Cantwell (Rutgers University, USA and University of Reading, UK) (pp. 1-31). USA: Oxford University Press.
Cao, L. (2016). Currency Wars and the erosion of dollar hegemony. Michigan Journal of International Law, 38(1), 57-118.
Cevik, S., Harris, R. D., & Yilmaz, F. (2017). Soft power and exchange rate volatility. International Finance, 20(3), 271-288.Available at: https://doi.org/10.1111/infi.12117 .
Chen, S.-S., & Chen, H.-C. (2007). Oil prices and real exchange rates. Energy Economics, 29(3), 390-404.Available at: https://doi.org/10.1016/j.eneco.2006.08.003 .
Cheung, Y. W., Chinn, M., & Nong, X. (2017). Estimating currency misalignment using the Penn effect: It is not as simple as it looks. International Finance, 20(3), 222-242.
Chey, H. (2013). The concepts, consequences, and determinants of currency internationalization. GRIPS Discussion Paper No. 13-03, National Graduate Institute for Policy Studies, Japan, May 2013.
Cohen, B. (2015). Currency power: Understanding monetary rivalry. Princeton; Oxford: Princeton University Press.
Cropsey, S., & McGrath, B. (2018). Maritime strategy in a new era of great power competition. Washington: Hudson Institute.
Di Nino, V., Eichengreen, B., & Sbracia, M. (2011). Real exchange rates, trade, and growth: Italy 1861-2011", Banca díItalia. Economic History Working Papers No. 10.
Dollar, D. (1992). Outward-oriented developing economies really do grow more rapidly: Evidence from 95 LDCs, 1976-1985. Economic Development and Cultural Change, 40(3), 523-544.Available at: https://doi.org/10.1086/451959 .
Dotsey, M., & Duarte, M. (2008). Nontraded goods, market segmentation, and exchange rates. Journal of Monetary Economics, 55(6), 1129-1142.Available at: https://doi.org/10.1016/j.jmoneco.2008.07.011 .
Dreyer, J. S. (1978). Determinants of exchange-rate regimes for currencies of developing countries: some preliminary results. World Development, 6(4), 437-445.Available at: https://doi.org/10.1016/0305-750x(78)90093-1 .
Du, Q., Yu, F., & Yu, X. (2017). Cultural proximity and the processing of financial information. Journal of Financial and Quantitative Analysis, 52(6), 2703-2726.Available at: https://doi.org/10.1080/17530350.2021.1879211 .
Efstathiou, K., & Papadia, F. (2018). The euro as an international currency: Bruegel Policy Contribution, No. 2018/25:18.
Eichengreen, B. (2008). The real exchange rate and economic growth. World Bank PREM Network, Commission on Growth and Development, Working Paper No. 4.
Eichengreen, Β., Mehl, A. J., & Chitu, L. (2017). Mars or mercury? The geopolitics of international currency choice. Working Paper No. 24145, National Bureau of Economic Research, December 2017.
Farrant, K., & Peersman, G. (2006). Is the exchange rate a shock absorber or a source of shocks? New empirical evidence. Journal of Money, Credit and Banking, 38(4), 939-961.
Fleming, M. J. (1973). On exchange rate unification. Economic Journal, 81(323), 467- 488.
FRED. (2021). Real broad effective exchange rate. Retrieved from; https://fred.stlouisfed.org/searchresults/?st=Real%20Broad%20Effective%20Exchange%20Rate.
Freudenberg, M. (2003). Composite indicators of country performance: A critical assessment. STI Working Paper, 2003/16, OECD Directorate For Science, Technology and Industry.
Frieden, J. A. (2015). Currency politics: The political economy of exchange rate policy. Princeton, NJ: Princeton University Press.
Frieden, J. (2017). Currency politics in the developing world. Harvard International Review, 38(2), 33 – 35.
GFP. (2021). Navy fleet strength by country (2021). Retrieved from: https://www.globalfirepower.com/navy-ships.php .
Gillingham, R. (2008). Poverty and social impact analysis by the IMF: Review of methodology and selected evidence. Washington, D.C: International Monetary Fund.
Glick, R., & Hutchison, M. (2011). Currency crises Federal Reserve Bank of San Francisco, Working Paper No. 2011-22.
Guichard, S., Cheung, C., & Brézillon, J. (2009). The role of international competitiveness and other factors in explaining export performance: OECD, Economics Department, Preliminary draft, 1-41. Retrieved from: http://www.dt.mef.gov.it/export/sites/sitodt/modules/documenti_it/analisi_progammazione/eventi/Guichard_Brezillon_Cheung_paper.pdf .
Ha, J., Stocker, M. M., & Yilmazkuday, H. (2019). Inflation and exchange rate pass-through. World Bank, Policy Research Working Paper No. 8780, March 2019.
Habib, M. M., Mileva, E., & Stracca, S. (2016). The real exchange rate and economic growth: revisiting the case using external instruments. European Central Bank, Working Paper Series No. 1921, June 2016.
Hassani, H., Ghodsi, M., & Howell, G. (2010). A note on standard deviation and standard error. Teaching Mathematics and its Applications: An International Journal of the IMA, 29(2), 108-112.
Hauner, D., & Kyobe, A. (2008). Determinants of government efficiency. IMF Working Paper, No. WP/08/228. International Monetary Fund, September 2008.
Heller, R. H. (1978). Determinants of exchange rate practices. Journal of Money Credit, and Banking, 10(3), 308–321.Available at: https://doi.org/10.2307/1991510 .
Hudrliková, L. (2013). Composite indicators as a useful tool for international comparison: The Europe 2020 example. Prague Economic Papers, 22(4), 459-473.
IMD. (2019). Methodology and principles of analysis: IMD World Competitiveness Center. Retrieved from: https://www.imd.org/centers/world-competitiveness-center/rankings/world-competitiveness/ .
IMF. (2019). What is real effective exchange rate (REER)? Retrieved from: https://datahelp.imf.org/knowledgebase/articles/537472-what-is-real-effective-exchange-rate-reer .
IMF. (2021a). IMF members' quotas and voting power, and IMF Board of Governors. Retrieved from: https://www.imf.org/external/np/sec/memdir/members.aspx .
IMF. (2021b). Financial development index database. Retrieved from: https://data.imf.org/?sk=F8032E80-B36C-43B1-AC26-493C5B1CD33B .
Karakostas, E. (2021). The effects of currency protectionism on the exports of the trade partners - a composite index. International Journal of Applied Economics, Finance and Accounting, 11(1), 23-34.
Kazi, U. M. K., Quaosar, G., & Nandi, D. C. (2013). Factors affecting the fluctuation in exchange rate of the Bangladesh: A co-integration approach. The international journal of social sciences, 18(1), 1-12.
Kenen, P. B. (1969). The theory of optimum currency areas: An eclectic view, in R. Mundell and A. Swoboda (eds.), Monetary problems of the international economy. Chicago: University of Chicago Press.
Laffaye, S., Lavopa, F., & Llana, C. P. (2013). Changes in the global economic power structure: Towards a multipolar world? CEI: Argentine Journal of International Economics, 1(1), 1-21.
Lim, E.-G. (2006). The Euro's challenge to the dollar: Different views from economists and evidence from COFER (Currency Composition of Foreign Exchange Reserves) and other Data. IMF Working Paper No. WP/06/153. Washington, D.C.: International Monetary Fund.
Luther, W. J. (2016). Cryptocurrencies, network effects, and switching costs. Contemporary Economic Policy, 34(3), 553-571.
Mauro, P. (1997). Why worry about corruption? Washington, D.C: International Monetary Fund.
Mazziotta, M., & Pareto, A. (2013). Methods for constructing composite indices: One for all or all for one. Rivista Italiana di Economia Demografia e Statistica, 67(2), 67-80.
Mbaye, S. (2012). Currency undervaluation and growth: Is there a productivity channel? Center for Studies and Research on International Development, MPRA Paper No. 44261.
McKinnon, R. I. (1963). Optimum currency areas. The American Economic Review, 53(4), 717-725.
Mundell, R. A. (1961). A theory of optimum currency areas. The American Economic Review, 51(4), 657-665.
Nardo, M., Saisana, M., Saltelli, A., Tarantola, S., Hoffman, A., & Giovannini, E. (2005). Handbook on constructing composite indicators: Methodology and user guide. OECD Statistics Working Papers, 2005/3, OECD Publishing.
Nuhu, M. (2021). Impact of exchange rate volatility on inflation in Nigeria. Journal of Contemporary Research in Business, Economics and Finance, 3(1), 26-38.Available at: https://doi.org/10.33094/26410265.2021.31.26.38 .
Ocampo, J. A. (2017). Resetting the international monetary (Non) system. UNU-WIDER Studies in Development Economics. Oxford: Oxford University Press.
Ochel, W., & Röhn, O. (2006). Ranking of countries-the WEF, IMD, Fraser and Heritage indices. CESifo DICE Report, 4(2), 48-60.
OECD. (2008). Handbook on constructing composite indicators methodology and user guide. France: Organization For Economic Co-Operation And Development.
Ogawa, E., & Muto, M. (2018). What determines utility of international currencies? RIETI Discussion Paper Series 18-E-077, November 2018.
Pollesch, N. L., & Dale, V. H. (2016). Normalization in sustainability assessment: Methods and implications. Ecological Economics, 130, 195-208.Available at: https://doi.org/10.1016/j.ecolecon.2016.06.018 .
Pustovitovskij, A., & Kremer, J. F. (2011). Structural power and international relations analysis “Fill your basket, Get your preferences. IEE Working Papers No. 191.
Rodriguez, C. M. (2016). Economic and political determinants of exchange rate regimes: The case of Latin America. International Economics, 147, 1-26.Available at: https://doi.org/10.1016/j.inteco.2016.03.001 .
Rodrik, D. (2008). The real exchange rate and economic growth. Brookings Papers on Economic Activity, 39(2), 365-412.Available at: https://doi.org/10.1353/eca.0.0020 .
Santoya, J., & Soutar, C. (2011). Estimating the real effective exchange rate (REER) for Belize. Research Department Central Bank Of Belize, Retrieved from; https://www.centralbank.org.bz/docs/default-source/4.5-conferences-and-working-papers/estimating-the-real-effective-exchange-rate-_reer_-for-belize-2011.pdf?sfvrsn=4
Savvides, A. (1990). Real exchange rate variability and the choice of exchange rate regime by developing countries. Journal of International Money and Finance, 9(4), 440-454.Available at: https://doi.org/10.1016/0261-5606(90)90021-q .
Schwab, K. (2019). The global competitiveness report 2019. World economic forum, centre for global competitiveness and performance Geneva. Switzerland. Retrieved from: https://www3.weforum.org/docs/WEF_TheGlobalCompetitivenessReport2019.pdf .
Song, X. (2014). Determinants of international currency competition in the international debt securities market: An empirical analysis based on dynamic panel data model. Bio Technology An Indian Journal, 10(15), 8410-8416.
Statista. (2021). Number of nuclear warheads worldwide as of January 2020. Retrieved from: https://www.statista.com/statistics/264435/number-of-nuclear-warheads-worldwide .
Steinberg, D., & Walter, S. (2013). The political economy of exchange rates, in: Gerard Caprio, Philippe Bacchetta, James R. Barth, Takeo Hoshi, Philip R. Lane, David G. Mayes, Atif R. Mian, Michael Taylor, (ed.) handbook of safeguarding global financial stability: Political, Social, Cultural, and Economic Theories and Models (Vol. 2, pp. 27-36): Elsevier.
Talukder, B., Hipel, K. W., & Van Loon, G. W. (2017). Developing composite indicators for agricultural sustainability assessment: Effect of normalization and aggregation techniques. Resources, 6(4), 1 – 27.Available at: https://doi.org/10.3390/resources6040066 .
Thacker, S. C. (1999). The high politics of IMF lending. World politics, 52(1), 38-75.
Van Der Meer, S. (2016). States’ motivations to acquire or forgo nuclear weapons: Four factors of influence. Journal of Military and Strategic Studies, 17(1), 209 – 239.
Vuving, A. L. (2009). How soft power works. Paper presented at the The Panel “Soft Power and Smart Power,” American Political Science Association Annual Meeting, Toronto.
Wait, C. V. R., & Thibane, T. A. (2015). The role of international institutions of global governance in steering globalization. ERSA Working Paper No. 531, Economic Research Southern Africa, July 2015.
Walesiak, M. (2018). The choice of normalization method and rankings of the set of objects based on composite indicator values. Statistics in Transition. New Series, 19(4), 693-710.
Wang, H., & Lu, Y.-C. (2008). The conception of soft power and its policy implications: A comparative study of China and Taiwan. Journal of contemporary China, 17(56), 425-447.
Whalley, J. (2009). Shifting economic power. OECD perspectives on global development (pp. 1-46). Paris: OECD.
WITS. (2021). World intermediate goods exports by country and region. Retrieved from: https://wits.worldbank.org/CountryProfile/en/Country/WLD/StartYear/2015/EndYear/2019/TradeFlow/Export/Indicator/XPRT-TRD-VL/Partner/ALL/Product/UNCTAD-SoP2 .
World Bank. (2019). Financial development.
Τhe Global Economy. (2021). List of available indicators. Retrieved from: https://www.theglobaleconomy.com/indicators_list.php .
Footnotes:
1.The same procedure is followed by Karakostas (2021).
2.Hudrliková (2013) states that the use of the Composite Index is one of the future methods of international comparison.
3. Pollesch and Dale (2016) report that normalization is essentially the process by which units of measurement are converted from the original units to common units of measurement.
4.Nardo et al. (2005) report that the most widely used linear set is the cumulative of weighted and normalized sub-indices.
5. Walesiak (2018) states that one of the five concentration - weighting measures (complex indicators) is the arithmetic mean.
7. Booysen (2002) states that complex indexing is based on the compilation of any number of economic, social and political indicators.
9. Standard deviation is a statistical measure used by researchers to calculate the amount of change or dispersion of a set of data values. The greater the standard deviation, the more the values are distributed. The smaller the standard deviation, the less the sample values are distributed. Variance is the square of the standard deviation and measures the variability of observations around the mean value. Essentially, the standard deviation characterizes the standard distance of an observation from the distribution center or mean value. The formula for standard deviation is as follows (Hassani, Ghodsi, & Howell, 2010): 
10. In the present study, fiat money is studied and not any other form of currency due to their non-present universal application. For example, a cryptocurrency is not so much accepted by trading agents than the legal tender government money (Luther, 2016). Furthermore, central banks are not very willing to adopt other types of currencies because that would cause the loss of control over both the medium of exchange and unit of account, aside from the incompetence to conduct monetary policy (Brunnermeier, James, & Landau, 2019).