Do Corruption, Inflation and Unemployment Influence the Income Inequality of Developing Asian Countries?
GholamReza Zandi1*
Raja Rehan2
Qazi Muhammad Adnan Hye3
Sadaf Mubeen4
Shujaat Abbas5
1Universiti Kuala Lumpur Business School, Malaysia. |
AbstractThis paper explores fertility preference and its associated factors among older Nigerian women within the reproductive ages 40 to 49. It considers the impact of proximate factors of place, wealth, education, use of contraceptives, and other associated factors on fertility preference. Using Nigeria Demographic and Health Survey (NDHS 2018) data, responses of 1357women of ages 40-49 years in the couples recode file were considered. Fertility preference is measured by “the desire for another child”. We use descriptive statistics and logistic regression to identify the associating factors and impacts of identified explanatory variables on the desire for another child. Result revealed up to 25% of women within ages 40-49 desire to have another child while 35% uses contraceptives. The desire by older women to have another child is higher in the rural areas than in urban areas while more than 50% with desire for another child have no education and are found practising Islam. Logistic regression result indicates that older women not using contraceptive have higher odd ratio with the desire for another child, those in urban areas have lower odd ratio while women in the Northeast and the Northwest have more than 2.5 chance of desiring for another child than those in the Southwest. This study concludes that the desire for pregnancy at later end of reproductive years must be controlled through women's education and community-based sensitization programs. |
Licensed: |
|
Keywords: |
|
Received: 25 May 2022 (* Corresponding Author) |
Funding: This study received no specific financial support. |
Competing Interests: The authors declare that they have no competing interests. |
1. Introduction
In spite of using similar strategies to knob the recent pandemic, the rising literature specifies that each country explains different mortality rate which is due to the existence of income inequality (Elgar, Stefaniak, & Wohl, 2020; Mollalo, Vahedi, & Rivera, 2020; Oronce, Scannell, Kawachi, & Tsugawa, 2020) . Hence, this opens a new debate and highlights the need to recognize cross-country economic determinants for measuring the inequality. Although, earlier studies have not provided a comprehensive overview and conclusive findings. Though, most of them agree that corruption, unemployment and inflation are the main determinants that reveal dynamic aspects of the cross-country income distribution (see (Milanovic, 2016; Nolan, Richiardi, & Valenzuela, 2019). Nevertheless, several questions are still rising for the identification of those determinants that help in achieving an appropriate method of income distribution without harming economic development (Gravina & Lanzafame, 2021). Besides, it is also clear that rising inflation, corruption and unemployment are the key components influencing income inequality of developing countries.
Visibly, numerous developing countries are also facing income inequality issues due to rising poverty and unemployment. Remarkably, prior investigations that focused on income inequality have focussed on regional or national issues by using different estimation techniques and data samples (see (Asteriou, Dimelis, & Moudatsou, 2014; Bukhari & Munir, 2016; Giri, Pandey, & Mohapatra, 2021) ). Hence, deliver inconsistent outcomes and are the core causes of identified gaps. For instance, current literature emphasizes separately on inflation, corruption and unemployment. Thus, offers only a limited opinion about the inequality sources. Likewise, another core approximation issue which is still unnoticed is endogeneity of the explored determinants. Technically, this is due to response effects of income inequality toward investigated determinants and that is also associated with various mechanisms such as ignorance of high level of inflation (Ravallion, 1997) corruption (Jong-Sung & Khagram, 2005) and significant association between unemployment and income inequality (Clark & Kavanagh, 1996).
Another important issue is inconsistent behaviour in treating nonlinearities that is addressed partially or only by considering specific channels (Figini & Gorg, 2011; Jauch & Watzka, 2016). Clearly, it is difficult to explain the nonlinear effects that’s why the similar determinants of inequality are acting differently in developing economies. Basically, these developing nations are not categorized in terms of technology and economic development as they have some other core matters such as expanding inflation, unemployment and corruption that impact on their income equality level. For instance, a low degree of financial development is considered a fundamental factor that reduces inequality. Thus, one may consider financial development to decrease income inequalities in developing countries. In fact, corruption may have impact on the financial development in developing countries. This suggests the existence of nonlinearities and their significant association with them and their numerous determinants are influenced by related implemented policies.
In view of this context, the current study aims is to add several additions to the prevailing literature by identifying cross-nations inequality determinants for the main Asian developing countries. This empirical inquiry depends on the large-scale balance panel data sample set of 15 developing economies from 2006 to 2020.Besides, the significant role of corruption, inflation and unemployment is considered as key determinants that impact on income inequality of developing countries. Furthermore, to handle the persistence and discussed endogeneity issue, a robust estimator i.e. System Generalized Method of Moments (GMM) offered by Arellano and Bover (1995) and Blundell and Bond (1998) is adopted.
The main findings of this study explain that corruption, unemployment and inflation affect income inequality level of the inspected Asian developing countries.
After a thorough introduction, the rest of the article is organized as follows: Section 2 focuses on former literature. Section 3 describes the data and research method for this study. Section 4 displays the study findings. Section 5 discusses the results of this study such as relationship of selected determinants with income inequality. Subsequently, Section 6 has the conclusion of this study. Lastly, this article ends with the implications and limitations of this investigation.
2. Literature Review
The empirical literature on the topic has offered a large number of investigations that have been conducted to examine the exact drivers of income inequalities (see (Asteriou et al., 2014; Bukhari & Munir, 2016; Giri et al., 2021; Gravina & Lanzafame, 2021; Huan, Binh, Duc, Hoi, & Thu, 2022) but the main focus of this study is to examine the combine impact of these determinants on income inequality. Therefore, this study considers GINI coefficient as a variable of interest. The coefficient of GINI is broadly used as a statistic to measure the income inequality and distribution. For instance, Druckman and Jackson (2008) examine expenditures and income inequalities by considering GINI and concluded that AR-GINI is a main measure for evaluating inequalities. In recent research, Odhiambo (2022) explores income inequality in the Sub- Saharan African countries by using data from 2004 to 2014. This study employs a GMM estimators to investigate a significant relationship among the information technology (IT), economic development and GINI coefficient. In particular, Odhiambo (2022) considers GINI as a dependent variable which represents income inequality in the selected countries. The results suggest a positive and significant relationship between IT and income inequality i.e. GINI coefficient. Similarly, Chambers and O'Reilly (2022) select GINI to measure income inequality in the USA. The panel data from 1997 to 2015 is used to identify the relationship between income inequality and other independent variables. By using a fixed effects model, this study designates a robust relationship among the studied variables and income inequality. Evidently, the former investigations considered GINI as a main variable that measures income inequality (see (Asteriou et al., 2014; Giri et al., 2021; Gravina & Lanzafame, 2021) ). The results are different but seem to agree that the main causes of economic inequality are corruption, unemployment and inflation. (see (Adeleye, 2020; Berisha, Dubey, Olson, & Gupta, 2020; Koh, Lee, & Bomhoff, 2020; Monfort, Ordóñez, & Sala, 2018; Nguyen, VO, LE, & Nguyen, 2020; Wu & Chang, 2019) ).
Furthermore, this study also used interest rate as an independent variable as most of the recent studies show a significant relationship between interest rate and income inequality (see (Berisha, Meszaros, & Olson, 2018; Berisha et al., 2020; Dinçer, Yüksel, Pınarbaşı, & Cetiner, 2019)). Dinçer et al. (2019) explored the impact of interest rate and bank credit on income inequality in Nigeria. The data set of 35 years from 1980 to 2015 was examined after collection. The results of the study revealed that the real interest rate on income inequality is channelled through bank credit. The results also indicate that real interest rate has an indirect relationship with income inequality and that when the model is augmented for a structural break, bank credit has an equalizing effect on income inequality.
Similarly, Berisha et al. (2018) also explored the relationship between interest rate and income inequality in the USA. The results reveal that rise in the stock market and family debt enhance income disparity. This study also identifies a negative relationship between interest rate-income as well as income inequality. In conclusion, the findings imply that high-income individuals obtain a larger part of their income from interest-rate sensitive assets. Later, Bozİk (2019) who examines the impact of real interest rates on income inequality confirms the findings of Berisha et al. (2018). This study is carried out to examine selected determinant’s relationship in developed and developing countries. The results highlighted that real interest rate has an impact on income inequality in both developed and developing countries. Samarina and Nguyen (2019) studied the relationship between monetary policy (including the interest rate factor) and income inequality in the European countries. According to the findings, an expansionary monetary policy decreases income inequality especially in the peripheral countries. The decomposition of income equality in France was then examined by Berisha. et al. (2020) by taking the impact of interest rate into account. The analysis found a significant increase in middle- class income inequality in France. Similarly, the distribution of interest rate changes is also varied.
Government officials may misuse their power when establishing and implementing public benefits programs for their personal benefit. This is a form of corruption that may enrich these officials who uses a largest amount of public funds. Clearly, corruption distorts the government's role of allocating resources to the public in this way. Nguyen et al. (2020) examined the relationship between corruption and income inequality in Vietnam. The seven -years data from 2011 to 2018 is examined to find the relationship among selected variables. Thus, the results concluded that there is a strong relationship between corruption and income inequality. Similarly, Uzar (2020) also examined the relationship between income inequality and corruption for OECD (Organization for Economic Cooperation and Development) countries. The results indicate a positive relationship between corruption and income inequality. The findings of Nguyen et al. (2020) and Uzar (2020) are similar with previous research by Sulemana and Kpienbaareh (2018) who explain that corruption promotes poverty by reducing the amount of social services provided to the poor by government.
Sulemana and Kpienbaareh (2018) also explored the relationship between corruption and inequality income in African countries. The results of the study revealed that there is a positive relationship between corruption and income inequality in the selected African countries. Moreover, this study explains that the wealthy or well-connected people pay bribes to be first in line for a rationed government commodity or service. Likewise, Dwiputri, Arsyad, and Pradiptyo (2018) also explored the relationship between corruption and income inequality in selected Asian countries. The results show a positive relationship between corruption and income inequality in the designated Asian republics. Bašná (2019) also examines the relationship between corruption and income inequality in selected 39 European countries. The results of the study show a positive and significant relationship between corruption and income inequality. The above discussed empirical investigations point out a strong significant relationship between corruption and income inequality (see (Nguyen et al., 2020; Sulemana & Kpienbaareh, 2018; Uzar, 2020) ). Corruption is also considered as a main cause of high unemployment ratio among various countries. (see (Apergis, Dincer, & Payne, 2010; Evans & Kelikume, 2019; Onchari, 2019) ). Thus, this study also focuses on unemployment by considering it as one of the important factors that significantly impacts the level of income inequality in developing countries.
Analytically, rare studies are found that deliver empirical evidences about the affiliation of unemployment with income inequality. For instance, Esquivias, Sethi, and Iswanti (2021) investigate the relationship between unemployment and income inequality of 30 European countries. The large-scale data of 18 years i.e. from 1990 to 2008 is used to examine the relationship. The results reveal that the unemployment has impact on income inequality level in the investigated European countries. However, unemployment is main reason that increases corruption in these countries. Similarly, Anser et al. (2020) explore the relationship of poverty (outcome of unemployment) and income inequality in the selected sixteen countries. . The data set of 24 years from 1990 to 2014 is examined by employing Generalized Method of Moments (GMM) estimator. The results show that there is no relationship between per capita income and crime rate and U-shaped relationship between poverty and per capita income. Moreover, they explain an inverted U-shaped relationship between income inequality and economic development. Monfort et al. (2018) discuss the income inequality and unemployment patterns in Europe. The findings reveal an insignificant relationship between unemployment and income inequality. However, they suggested that monetary policy of the country plays a vital role in increasing and decreasing income inequality levels in the country. Clearly, the above discussion points out that income inequality leads to unemployment. Similarly, income inequality not only raises unemployment level but it also becomes main cause of inflation (see Ullah, Tunio, Ullah, and Nabi (2022)).
Ullah et al. (2022) investigate the relationship between income inequality and capital openness in selected 28 Asian countries during the period of 1970 to 2018. By employing random effects model and GMM estimator, the results specify significant relationship of income inequality with inflation and unemployment. Similarly, Altunbaş and Thornton (2022) investigate income inequality and its impact on inflation. The findings concluded that policy makers must adopt taxation, social safety and structural reforms to strengthen labour bargaining power.
Considering all of the above deliberated literature, it is clear that corruption, inflation and unemployment are the main determinants that have impact on income inequality level of countries. However, there are rare studies that explore the combine impact of these variables on income inequality. The purpose of the current study is to identify the impact of these variables on income inequality of developing Asian countries.
3. Research Methods
Notably, by using secondary data, this research examines the role of corruption, inflation and unemployment in income inequality of 12 core developing Asian countries which are India, Indonesia, Pakistan, Bahrain, Bangladesh, Iraq, Iran, Jordan, Thailand, Turkey, Vietnam and Yemen. For this purpose, 15 years balanced panel data from 2006 to 2020 is collected from the World Bank (WB), World Development Indicators (WDI) and Transparency International webs. Analytically, this study used the panel data estimation model that has been adopted by Yadav, Antil, Gupta, and Kandpal (2022), Policardo and Carrera (2018) and Ata and Arvas (2011) as mentioned below:
Where
GINII = GINI Index
i = Country
t = Time Period
CPI = Corruption Perceptions Index
INF = Inflation
UNE = Unemployment
IR = Interest Rate
This study used income inequality as a dependent variable i.e. measured by the GINI index. GINI coefficient is obtained from the Lorenz curve model and explained as a ratio of the range between the perfect equality line and Lorenz curve (Thalassinos, Ugurlu, & Muratoglu, 2012). Analytically, this curve plots the relationship between the proportion of total earnings and population growing percentage that varies from 0 to 1. Statistically, 0 explains perfect and significant equality whereas1 represents inequality existence (Thalassinos et al., 2012). Moreover, corruption, inflation and unemployment are used as independent variables. Technically, corruption is measured as the corruption perception index developed by transparency international. Similarly, inflation is measured as the consumer price (annual percentage) and unemployment is measured as the unemployment, total (% of the total labour force). In addition, the current study has also used interest rate as the control variable which is measured as the deposit interest rate (percentage). Table 1 shows these variables and measurements.
c |
Variables | Measurement | References | Sources |
01 |
Interest Rate | Deposit Interest Rate (%) | Berisha et al. (2020); Dinçer et al. (2019); Berisha et al. (2018); | WDI |
02 |
Income Inequality | GINI Index | Odhiambo (2022); Chambers and O'Reilly (2022); Berisha et al. (2020) | World Bank |
03 |
Corruption | Corruption Perceptions Index | Uzar (2020); Nguyen et al. (2020); Sulemana and Kpienbaareh (2018); Bašná (2019) | Transparency International |
04 |
Inflation | Inflation Consumer Prices (Annual %) | Ullah et al. (2022); Altunbaş and Thornton (2022) | WDI |
05 |
Unemployment | Unemployment, total (% of total labor force) | Esquivias et al. (2021); Monfort et al. (2018) | WDI |
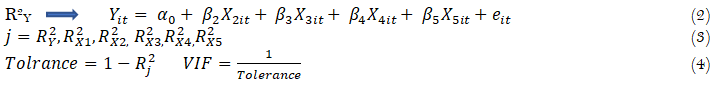
Statistically, this study examines the mean, minimum, maximum and standard deviation of the variables by using descriptive statistics. Moreover, this study also investigates the correlation among the variables by using a correlation matrix. Besides, the multicollinearity issue in the model is checked by using Variance Inflation Factor (VIF). Technically, multicollinearity analysis is grounded on the measure clarified by numerous scholars who elucidate that the variables own serious multicollinearity matter. Analytically, if its VIF value surpasses 10 (see (Akinwande, Dikko, & Samson, 2015; Gujarati & Porter, 2009; Hernawati, Hadi, Aspiranti, & Rehan, 2021) ). The equations of the VIF are mentioned below:
Furthermore, following the studies of earlier researchers (see (Atif, Srivastav, Sauytbekova, & Arachchige, 2012; Faustino & Vali, 2013; Perugini & Tekin, 2022) ) this investigation develops balance panel data model (PDM) to examine the relationship between the selected variables. Technically, a panel data model is a grouping of cross-sectional and time-series data (Abdul Razak, Rehan, Zainudin, & Hussain, 2018). Similarly, a balanced panel data model indicates all time intervals with comparable observations. The panel data model is demonstrated as follows:
Here, ‘i' indicates individuals (i=1, 2,3…., N) and ‘t’ indicates as time period (t=1,2, 3,….,T), explains dependent variable, is taken as definite cross sectional effects and specifies time series effects. Moreover, is explanatory variable, error term effect which has zero mean constant variance. Consequently, this empirical investigation accepts panel data random effects model and GMM estimator to examine the relationships among the selected variables. In panel data fixed effects model parameters are fixed quantities. However, in random effects model the parameters are random quantities and not fixed (Abdul Razak et al., 2018).
This study accepts the Breusch Pagan Lagrange Multiplier test which is explain by Breusch and Pagan (1980) to find static panel data model, pooled or random effects is appropriate to examine the selected variables. Primarily, Breusch Pagan Lagrange Multiplier (BP LM) test adopts ‘m’ statistics of Hausman (1978) to check the hypothesis. Statistically, the null hypothesis of BP LM test indicates the acceptance for pooled model (H0: Accept Pooled OLS). However, if H0 is not accepted then we go with the model of random effects (H1: Accept Random Effects). Accordingly, if null hypothesis (H0) for the acceptance of pooled OLS is rejected then this study moves to Hausman test. Technically, Hausman test is used to examine the acceptance of suitable panel data model between fixed effects or random effects model (Breusch & Pagan, 1980). The econometric equation for the Hausman test is mentioned as below:
This study uses random effects model to test the investigation among the selected variables. Precisely, in static panel data random effects model parameters are random variables (Serrasqueiro & Nunes, 2008). Hence, the equations for the panel data random model are mentioned below:

In the above equation, μit represents the time-series error and combined cross-section component, whereas, is because of error due to time series and individual components. Thus, the random effects analysis model of this study is given as below:
The GMM estimator in this study is also used to check the strong relationship between the variables. GMM model has features for controlling the effects of endogeneity and heterogeneity. Moreover, this study selects the difference GMM estimator to explore the dynamic relationship between the examined variables. The difference GMM has ability to change the explanatory variables by using their first difference which does not differ overtime. Besides, it settles the fixed effects related issues by using first difference of dependent variable but not less than prior two years (Rehan & Abdul Hadi, 2019). Analytically, the dynamic panel data model is used when existing value of dependent variable depends on its prior period realizations (Flannery & Rangan, 2006). In other words, this model allows to use lag of dependent variable as an explanatory variable (Branas-Garza, Bucheli, & Garcia-Munoz, 2011). Actually, the Ordinary Least Square (OLS) model ignores fixed effects and the panel data structure resulting in biased outcomes of coefficient approximation for the lagged value of dependent variable (Rehan, Abdul, & Hussain, 2019). The fixed effects model is not able to handle the unobserved heterogeneity. Thus, it ignores the model error term and report the existence of correlation between the lagged values of the explanatory variables and become endogenous. Thus, in this condition the dynamic model is supportive which accepts dependent variables lag values as an independent variable. The equation for the model is mentioned as under:
The GMM model gives the best results even when the data have autocorrelation and heteroscedasticity issues. Technically, the GMM model is found best to handle endogeneity among the variables. The equation using understudy variables is given below:
3. Findings
The descriptive statistics is performed to check the variables statistics such as maximum, minimum, mean and standard deviation. The results indicated in Table 2 display that the mean value of GINII is 29.873. In addition, the results also show that the average value of CPI was 46.872 and the mean value of INF is 5.783 per cent. Finally, the findings also expose that the mean value of UNE is 23.874 while the average value of IR is 5.749 per cent. Clearly, the data is not displaying any extreme deviations as all obtained values are nearer to others.
| Variable | Obs. |
Mean |
Std. Dev. |
Min |
Max |
| GINII | 180 |
29.873 |
3.873 |
22.873 |
37.983 |
| CPI | 180 |
46.872 |
4.763 |
44.893 |
59.823 |
| INF | 180 |
5.783 |
2.871 |
3.873 |
7.873 |
| UNE | 180 |
23.874 |
3.832 |
20.982 |
31.287 |
| IR | 180 |
5.749 |
2.093 |
4.872 |
9.093 |
Subsequently, this study performs various diagnostic tests to determine the goodness fit of the constructed models. For instance, this study performs the correlation test to find the statistical relationships among the variables by using a correlation matrix. The outcomes mentioned in Table 3 expose that the CPI, INF, UNE and IR have positive relationships with the GINI index. Clearly, the findings revealed that income inequality in developing Asian countries has significant relationship with the selected variables.
| Variables | GINII |
CPI |
INF |
UNE |
IR |
| GINII | 1.000 |
||||
| CPI | 0.487 |
1.000 |
|||
| INF | 0.563 |
0.634 |
1.000 |
||
| UNE | 0.522 |
0.762 |
0.672 |
1.000 |
|
| IR | 0.477 |
0.529 |
0.541 |
0.529 |
1.000 |
Moreover, this study uses VIF to carry out multicollinearity test. The results obtained from VIF test are mentioned in Table 4. The results indicate that the values are lower than the 10. Thus, there is no multicollinearity issue exists in the analyzed data.
VIF |
1/VIF |
|
| CPI | 3.107 |
0.322 |
| INF | 2.825 |
0.354 |
| UNE | 2.762 |
0.362 |
| IR | 2.913 |
0.343 |
| Mean VIF | 2.902 |
. |
3.1. Static Model Estimation
In addition, the present research has also examined the suitable model between “fixed and random models” using the Hausman test. The results of the Hausman test mentioned in Table 5 expose that the probability value is larger than 0.05 that exposes the Random effect model (REM) is suitable.
After conducting the diagnostic testing, this study executes Breusch Pagan LM test. Table 5 presents the results obtained from the BP LM test. P -value recommends the acceptance of an alternate hypothesis i.e. H1 (p<0.05). Thus, the results indicate that the model of random effects is more effective than the model of pooled OLS.
| H0: Accept Pooled OLS H1: Accept Random Effects |
|
| m Value | P > m |
| 1800 | 0.0001* |
Note: Significant at 5%. |
Subsequently, this study performs the Hausman test to find the best static model for the empirical investigation of this study. Again, the findings in Table 6 show that the probability value is higher than the 0.05. Evidently, the result specifies that the random effects model is more effective and suitable choice to perform analysis.
Table 7 displays the results obtained from the random effects model. The findings explain that corruption (CPI), inflation (INF) and unemployment (UNE) have a significant positive relationship with the income inequality (GINII) in investigating developing countries. In addition, the R square value (0.594) also reveals that 41.9 per cent of alterations in the GINI index is because of the studied variables that are CPI, INF, UNE and IR.
| GINII | Beta |
S.D. |
t-value |
p-value |
L.L. |
U.L. |
Sig |
|
| CPI | 0.483 |
0.187 |
2.58 |
0.030 |
0.722 |
1.432 |
** |
|
| INF | 1.634 |
0.563 |
2.90 |
0.021 |
0.731 |
1.849 |
** |
|
| UNE | 0.439 |
0.122 |
3.60 |
0.012 |
1.005 |
2.091 |
** |
|
| IR | 0.983 |
0.329 |
2.99 |
0.019 |
0.452 |
1.323 |
** |
|
| Constant | 0.872 |
0.298 |
2.93 |
0.017 |
0.982 |
2.071 |
** |
|
| Overall r-squared | 0.594 |
Number of obs |
180 |
|||||
| Chi-square | 24.983 |
Prob > chi2 |
0.000 |
|||||
| R-squared within | 0.419 |
R-squared between |
0.763 |
|||||
Note: Significant at 5%. |
3.2 Dynamic Model Estimation
This study selects GMM estimators to examine the robust dynamic relationships between the selected dependent and independent variables. This study also performs GMM diagnostics test to check the robustness and viability of the selected model. For instance, the Sargan Test is conducted to check the existence of exogeneity issue in the model. The results displayed in below Table 8 explain that the model is free from exogeneity issues and null hypothesis is accepted.
| H0: Instruments used in model are valid. H1: Instruments used in model are not valid. |
|
Statistics |
Prob > ChiSq |
7333 |
0.9432 |
After conducting the Sargan Test, this study also performs the AR (m) auto regression test to check the autocorrelation issue in the model. Clearly, the results shown in Table 9 show that the model is free from autocorrelation. Thus, null hypothesis is accepted.
| H0: Absence of autocorrelation on error term H1: Presence of autocorrelation on error term |
||
Lag |
Statistics |
Prob > ChiSq |
1 |
1.72 |
0.8932 |
Having confirmed that model is free from diagnostic issues for the dynamic robust test, this study uses GMM estimation. Hence, the results of the GMM model are mentioned in Table 10 that reveal corruption, inflation and unemployment have a positive relationship with the GINI index and significantly enhance the income inequality in the investigated developing countries.
| GINII | Beta |
S.D. |
t-value |
p-value |
L.L. |
U.L. |
Sig |
| CPI | 0.563 |
0.198 |
2.84 |
0.012 |
0.543 |
1.347 |
** |
| INF | 0.438 |
0.182 |
2.41 |
0.023 |
0.346 |
1.069 |
** |
| UNE | 1.983 |
0.872 |
2.27 |
0.032 |
1.020 |
2.877 |
** |
| IR | 2.955 |
1.092 |
2.71 |
0.014 |
1.120 |
2.967 |
** |
Note: ** p<.05. |
5. Discussions
The results show that CPI has a positive relation with income inequality in selected Asian developing countries. Evidently, these results match with Nguyen et al. (2020) who examine the role of corruption in income inequality and suggest that the countries where officials are at significant business positions are engaged in corruption. Thus, this creates income inequality within the country. Similarly, the results are also similar with the former study of Policardo, Carrera, and Risso (2019) who discovered that the different types of corruption like lobbying, extortion, bribery and embezzlement have negative impact on the national wealth of the country. Interestingly, the outcomes also postulate that inflation has a positive relation with income inequality in selected Asian nations. From literature, the obtained results are consistent with the findings of Siami-Namini and Hudson (2019) who state that inflation is one of the main causes which increases income inequality among nations. Moreover, the results are also similar with the findings of Law and Soon (2020) who concluded that during the inflation period the rich become richer and the poor become poorer. Thus, inflation has significant relationship with the income inequality.
Furthermore, the results also specify a significant positive relationship between unemployment and income inequality. Statistically, these results match with the presented findings of Salim, Rustam, Haeruddin, Asriati, and Putra (2020) who concluded that the employment status of the people impact on their incomes, possessions and living standards. Similarly, Carriero and Filandri (2019) reveal that the people who are unemployed are sharing the national income. Also, the results indicate that the interest rate is positively associated with income inequality in investigated Asian developing countries. Clearly, these outcomes are similar with the findings of Taghizadeh‐Hesary, Yoshino, and Shimizu (2020) who explain that interest rate is a capital cost on borrowed money. Thus, the rising interest rate leaves a heavy burden on the people which later also high-income inequality in a country.
6. Conclusion
The purpose of this study is to address the issue of income inequality and present new ways to overcome it. Besides, this study is also conducted to examine the influence of corruption, inflation and unemployment as well as interest rate on income inequality particularly in the developing Asian countries. The findings show that selected Asian countries are facing income inequality which is because of rising corruption, Inflation and unemployment Corruption, Inflation and unemployment have significantly positive and robust relationships with income inequality as reported by both selected estimators that are the random effects model and GMM (see Table 7 & 8).
In conclusion, it is evident that the examined variables namely inflation, unemployment and corruption are the key factors that increase income inequality in the developing countries. Unemployed people do not have earnings so, they spend their savings and use national resources resulting in income inequality. In the same vein, an increased interest rate and inflation mean high borrowing cost. Thus, people spend less and investors stop investments which upsurges income inequality. Likewise, corruption is also one of the main causes of the slow economic growth which increases income inequality.
7. Implications
The current study possesses a distinctive place in the literature as it has a great contribution to economic literature. The study sheds light on the role of corruption, Inflation and unemployment as well as interest rates in determining income inequality. The effects of corruption, Inflation, unemployment and interest rate on income inequality have never been thoroughly studied before. This study provides guide line to the government, public and private institutions so that they implement their policies while keeping income inequality in mind.
8. Limitations
The present study has delimited to only three factors such as corruption, Inflation, and unemployment in order to determine income inequality factors. The future researchers will need to examine other factors that affect income inequality such as economic growth in the developed Asian countries.
References
Abdul Razak, A. H., Rehan, R., Zainudin, Z., & Hussain, H. I. (2018). Capital structure determinants of Shariah and Non-Shariah companies at Bursa Malaysia. Opcion, 34(16), 678-695.
Adeleye, B. N. (2020). Unbundling interest rate and bank credit nexus on income inequality: Structural break analysis from Nigeria. Journal of Financial Regulation and Compliance, 29(1), 63-78 Available at: https://doi.org/10.1108/JFRC-04-2020-0035.
Akinwande, M. O., Dikko, H. G., & Samson, A. (2015). Variance inflation factor: As a condition for the inclusion of suppressor variable (s) in regression analysis. Open Journal of Statistics, 5(7), 754-767.Available at: https://doi.org/10.4236/ojs.2015.57075.
Altunbaş, Y., & Thornton, J. (2022). Does inflation targeting increase income inequality? Journal of Post Keynesian Economics, 1-23.
Anser, M. K., Yousaf, Z., Nassani, A. A., Alotaibi, S. M., Kabbani, A., & Zaman, K. (2020). Dynamic linkages between poverty, inequality, crime, and social expenditures in a panel of 16 countries: Two-step GMM estimates. Journal of Economic Structures, 9(1), 1-25.Available at: https://doi.org/10.1186/s40008-020-00220-6.
Apergis, N., Dincer, O. C., & Payne, J. E. (2010). The relationship between corruption and income inequality in US states: Evidence from a panel cointegration and error correction model. Public Choice, 145(1), 125-135.
Arellano, M., & Bover, O. (1995). Another look at the instrumental variable estimation of error-components models. Journal of Econometrics, 68(1), 29-51.
Asteriou, D., Dimelis, S., & Moudatsou, A. (2014). Globalization and income inequality: A panel data econometric approach for the EU27 countries. Economic Modelling, 36, 592-599.
Ata, A. Y., & Arvas, M. A. (2011). Determinants of economic corruption: A cross-country data analysis. International Journal of Business and Social Science, 2(13), 161-169.
Atif, S. M., Srivastav, M., Sauytbekova, M., & Arachchige, U. K. (2012). Globalization and income inequality: A panel data analysis of 68 countries. ZBW-Leibniz Information Centre for Economics.
Bašná, K. (2019). Income inequality and level of corruption in post-communist European countries between 1995 and 2014. Communist and Post-Communist Studies, 52(2), 93-104.Available at: https://doi.org/10.1016/j.postcomstud.2019.05.002.
Berisha, E., Meszaros, J., & Olson, E. (2018). Income inequality, equities, household debt, and interest rates: Evidence from a century of data. Journal of International Money and Finance, 80, 1-14.Available at: https://doi.org/10.1016/j.jimonfin.2017.09.012.
Berisha, E., Dubey, R. S., Olson, E., & Gupta, R. (2020). Decomposition of income inequality in France: The role of interest rate. Available at SSRN 3452260, 2, 1-28.Available at: https://dx.doi.org/10.2139/ssrn.3452260.
Blundell, R., & Bond, S. (1998). Initial conditions and moment restrictions in dynamic panel data models. Journal of Econometrics, 87(1), 115-143.
Bozİk, M. S. (2019). Real interest rate and its effect on income inequality. Journal of Economic Policy Researches, 6(2), 107-120.
Branas-Garza, P., Bucheli, M., & Garcia-Munoz, T. (2011). Dynamic panel data: AUseful technique in experiments. Department of Economic Theory and Economic History of the University of Granada, Technical Report 10/22.
Breusch, T. S., & Pagan, A. R. (1980). The lagrange multiplier test and its applications to model specification in econometrics. Review of Econometric Studies, 47(1), 239–253.
Bukhari, M., & Munir, K. (2016). Impact of globalization on income inequality in selected Asian countries.
Carriero, R., & Filandri, M. (2019). Support for conditional unemployment benefit in European countries: The role of income inequality. Journal of European Social Policy, 29(4), 498-514.Available at: https://doi.org/10.1177/0958928718815624.
Chambers, D., & O'Reilly, C. (2022). Regulation and income inequality in the United States. European Journal of Political Economy, 72, 102101.
Clark, C. M., & Kavanagh, C. (1996). Basic income, inequality, and unemployment: Rethinking the linkage between work and welfare. Journal of Economic Issues, 30(2), 399-406.
Dinçer, H., Yüksel, S., Pınarbaşı, F., & Cetiner, İ. T. (2019). Measurement of economic and banking stability in emerging markets by considering income inequality and nonperforming loans Maintaining financial stability in times of risk and uncertainty (pp. 49-68): IGI Global.
Druckman, A., & Jackson, T. (2008). Measuring resource inequalities: The concepts and methodology for an area-based Gini coefficient. Ecological Economics, 65(2), 242-252.
Dwiputri, I. N., Arsyad, L., & Pradiptyo, R. (2018). The corruption-income inequality trap: A study of Asian countries. Economics Discussion Papers. (No. 2018-81).
Elgar, F. J., Stefaniak, A., & Wohl, M. J. (2020). The trouble with trust: Time-series analysis of social capital, income inequality, and COVID-19 deaths in 84 countries. Social Science & Medicine, 263, 113365.
Esquivias, M. A., Sethi, N., & Iswanti, H. (2021). Dynamics of income inequality, investment, and unemployment in Indonesia. Journal of Population and Social Studies, 29, 660-678.Available at: https://doi.org/10.25133/jpssv292021.040.
Evans, O., & Kelikume, I. (2019). The impact of poverty, unemployment, inequality, corruption and poor governance on Niger Delta militancy, Boko Haram terrorism and Fulani herdsmen attacks in Nigeria. International Journal of Management, Economics and Social Sciences, 8(2), 58-80.
Faustino, H. C., & Vali, C. (2013). The effects of globalization and economic growth on income inequality: Evidence for 24 OECD countries.
Figini, P., & Gorg, H. (2011). Does foreign direct investment affect wage inequality? An empirical investigation. The World Economy, 34(9), 1455-1475.
Flannery, M. J., & Rangan, K. P. (2006). Partial adjustment towards target capital structure. Journal of Financial Economics, 79(3), 469-506.
Giri, A. K., Pandey, R., & Mohapatra, G. (2021). Does technological progress, trade, or financial globalization stimulate income inequality in India? The Journal of Asian Finance, Economics, and Business, 8(2), 111-122.
Gravina, A. F., & Lanzafame, M. (2021). Finance, globalisation, technology and inequality: Do nonlinearities matter? Economic Modelling, 96, 96-110.
Gujarati, D. N., & Porter, D. C. (2009). Basic econometrics (5th ed.). USA: McGraw-Hill.
Hausman, J. A. (1978). Specification tests in econometrics. Econometrica, 46(6), 1251–1271.
Hernawati, E., Hadi, A. R. A., Aspiranti, T., & Rehan, R. (2021). Non-performing financing among Islamic Banks in Asia-Pacific region. Economy Notebooks, 44(126), 1-9.
Huan, D. M., Binh, P. T. T., Duc, D. A., Hoi, L. Q., & Thu, N. T. H. (2022). The role of internal migration in poverty reduction of Vietnam. Journal of Social Economics Research, 9(1), 52–60.Available at: https://doi.org/10.18488/35.v9i1.3007.
Jauch, S., & Watzka, S. (2016). Financial development and income inequality: A panel data approach. Empirical Economics, 51(1), 291-314.
Jong-Sung, Y., & Khagram, S. (2005). A comparative study of inequality and corruption. American Sociological Review, 70(1), 136-157.
Koh, S. G., Lee, G. H., & Bomhoff, E. J. (2020). The income inequality, financial depth and economic growth nexus in China. The World Economy, 43(2), 412-427.Available at: https://doi.org/10.1111/twec.12825.
Law, C.-H., & Soon, S.-V. (2020). The impact of inflation on income inequality: The role of institutional quality. Applied Economics Letters, 27(21), 1735-1738.Available at: https://doi.org/10.1080/13504851.2020.1717425.
Milanovic, B. (2016). Global inequality: A new approach for the age of globalization: Harvard University Press.
Mollalo, A., Vahedi, B., & Rivera, K. M. (2020). GIS-based spatial modeling of COVID-19 incidence rate in the continental United States. Science of the Total Environment, 728, 138884.Available at: https://doi.org/10.1016/j.scitotenv.2020.138884.
Monfort, M., Ordóñez, J., & Sala, H. (2018). Inequality and unemployment patterns in Europe: Does integration lead to (real) convergence? Open Economies Review, 29(4), 703-724.Available at: https://doi.org/10.1007/s11079-018-9488-x.
Nguyen, H. T., VO, T. H. N., LE, D. D. M., & Nguyen, V. T. (2020). Fiscal decentralization, corruption, and income inequality: Evidence from Vietnam. The Journal of Asian Finance, Economics and Business, 7(11), 529-540.Available at: https://doi.org/10.13106/jafeb.2020.vol7.no11.529.
Nolan, B., Richiardi, M. G., & Valenzuela, L. (2019). The drivers of income inequality in rich countries. Journal of Economic Surveys, 33(4), 1285-1324.
Odhiambo, N. M. (2022). Information technology, income inequality and economic growth in Sub-Saharan African countries. Telecommunications Policy, 46(6), 102309.
Onchari, D. (2019). The relationship between corruption and unemployment rates in Kenya. Academy Journal of Social Sciences, 6(17), 309-318.
Oronce, C. I. A., Scannell, C. A., Kawachi, I., & Tsugawa, Y. (2020). Association between state-level income inequality and COVID-19 cases and mortality in the USA. Journal of General Internal Medicine, 35(9), 2791-2793.
Perugini, C., & Tekin, İ. (2022). Financial development, income inequality and governance institutions. Panoeconomicus, 69(3), 353-379.
Policardo, L., & Carrera, E. J. S. (2018). Corruption causes inequality, or is it the other way around? An empirical investigation for a panel of countries. Economic Analysis and Policy, 59, 92-102.Available at: https://doi.org/10.1016/j.eap.2018.05.001.
Policardo, L., Carrera, E. J. S., & Risso, W. A. (2019). Causality between income inequality and corruption in OECD countries. World Development Perspectives, 14, 1102-1125.Available at: https://doi.org/10.13106/jafeb.2020.vol7.no11.529.
Ravallion, M. (1997). Can high-inequality developing countries escape absolute poverty? Economics Letters, 56(1), 51-57.
Rehan, R., & Abdul Hadi, A. R. (2019). Capital structure determinants of Shariah and non-Shariah companies at Bursa Malaysia–dynamic approach. International Journal of Innovation, Creativity and Change, 6(8), 334-345.
Rehan, R., Abdul, H. A. R., & Hussain, H. I. (2019). Sectorial-specific capital structure determinants-evidence from Bursa Malaysia. International Journal of Innovation, Creativity and Change, 6(8), 346-357.
Salim, A., Rustam, A., Haeruddin, H., Asriati, A., & Putra, A. H. P. K. (2020). Economic strategy: Correlation between macro and microeconomics on income inequality in Indonesia. The Journal of Asian Finance, Economics, and Business, 7(8), 681-693.Available at: https://doi.org/10.13106/jafeb.2020.vol7.no8.681.
Samarina, A., & Nguyen, A. D. (2019). Does monetary policy affect income inequality in the euro area? Netherlands Central Bank, Research Department. (No. 626).
Serrasqueiro, Z., & Nunes, P. M. (2008). Determinants of capital structure: Comparison of empirical evidence from the use of different estimators. International Journal of Applied Economics, 5(1), 14–29.
Siami-Namini, S., & Hudson, D. (2019). Inflation and income inequality in developed and developing countries. Journal of Economic Studies, 46(3), 611-632.Available at: https://doi.org/10.1108/JES-02-2018-0045.
Sulemana, I., & Kpienbaareh, D. (2018). An empirical examination of the relationship between income inequality and corruption in Africa. Economic Analysis and Policy, 60, 27-42.Available at: https://doi.org/10.1016/j.eap.2018.09.003.
Taghizadeh‐Hesary, F., Yoshino, N., & Shimizu, S. (2020). The impact of monetary and tax policy on income inequality in Japan. The World Economy, 43(10), 2600-2621.Available at: https://doi.org/10.1111/twec.12782.
Thalassinos, E., Ugurlu, E., & Muratoglu, Y. (2012). Income inequality and inflation in the EU. European Research Studies, 15(1), 127-140.
Ullah, I., Tunio, F. H., Ullah, Z., & Nabi, A. A. (2022). The impact of capital account openness on income inequality: Empirical evidence from Asia. The Journal of Asian Finance, Economics and Business, 9(2), 49-59.
Uzar, U. (2020). Is income inequality a driver for renewable energy consumption? Journal of Cleaner Production, 255, 120287.Available at: https://doi.org/10.1016/j.jclepro.2020.120287.
Wu, W.-C., & Chang, Y.-T. (2019). Income inequality, distributive unfairness, and support for democracy: Evidence from East Asia and Latin America. Democratization, 26(8), 1475-1492.Available at: https://doi.org/10.1080/13510347.2019.1656198.
Yadav, S., Antil, N., Gupta, D., & Kandpal, V. (2022). A panel data examination of income inequality in 24 African countries. Journal of Public Affairs, 22(3), e2563.Available at: https://doi.org/10.1002/pa.2563.