Cointegration Relationship between Growth, Inequality and Poverty In Tunisia
Hasna Khemili1
Mounir Belloumi2
1Faculty of Economics and Management of Sousse, LAMIDED, University of Sousse, Tunisia. |
AbstractThe aim of this paper is to investigate the direction of causality between poverty, inequality and economic growth in Tunisia using time series data covering the period 1970-2013. We use in this paper the ARDL bound testing approach to cointegration and Toda and Yamamoto (1995) modification of the Granger causality test. The result of bound testing reveals that there is an evidence of long-run relationship among the variables. In long term, we conclude that there is a positive relationship between income inequality and poverty. However, in the short-run there is a positive relation between inequality and growth to poverty. The results of Toda and Yamamoto indicate that there is a unidirectional causal relationship running from economic growth to poverty. We, therefore, recommend that governments should intense efforts in reinforcement the economic growth and should pay attention on its sustainability. In addition, we found unidirectional causality between poverty and inequality. However, on the other hand, the results of this paper indicate a bidirectional causality between inequality and economic growth. Therefore, the political leaders should focus their efforts on the middle class and poorest to reduce inequality and, therefore, support the growth that can reduce poverty. |
Licensed: |
|
Keywords: JEL Classification: |
|
| (* Corresponding Author) |
1. Introduction
Since the 80s, according to Ayari, Srasra, and Trabelsi-Ayadi (2005) the priority of the Tunisian government, was to rebuild the institutions and the public service and to address the void left by French officials who walked out of Tunisia and went to their native country after independence. This strategy, stressed the need of central planning and the cooperation of public and private sectors. It also insisted on human development as education, family planning and birth control, women's rights and the eradication of poverty
In 1995, Tunisia signed an association agreement with the European Union. The agreement was focused on creating a free trade area within a period of twelve years. During this phase, the GDP has grown with an accelerated rate compared to 1970 years and raised to 5.5%. In addition, poverty dropped intensely, from 40% in 1970 to risen to 6.2% in 19951 .
According to different surveys conducted by Tunisian national institute of statistics (NIS) we noticed that the average spending increasing from one year to another. From 1995 to 2005 it increased up to 41.2%, followed by 34.1% from 2005 to 2010, comparing to increase of 9.5% from 1985 to 19952 .
This growth could be affected directly by Inequality and poverty were the social problems, specially increased after the revolution in December 2010. In Tunisia, the proportion of households living below the poverty line rose up dramatically those last years. It reached 24.7% in 2013 and 20% 3 in 2015. Inequality and poverty became a new issue that economists seek to understand due to shocks, global crises and revolutions especially within the Arab countries.
Poverty in Tunisia could be related to the distribution of national income between households and regions. As noted above, it is fundamental in studying poverty to examine the relation between inequality, growth and poverty.
Our study seeks to investigate the cointegration relationship between economic growth, income inequality and poverty rate. The contribution of our work is to explore this relationship using new indicator of poverty, which is the consumption per capita. We chose to apply the ARDL model in the case of our country.
The objective of this study is to examine the causal relation between inequality, poverty, and economic growth in Tunisia using the Toda-Yamamoto test.
The remainder of our paper is organized as follows. After an introduction and a brief literature review, in the section 3, we present the data, while Section 4, deals with the estimation technique and the empirical analysis of the results. Section 5 concludes some policy implications and recommendations.
2. Literature Revue
The literature on the link between economic growth, poverty and inequality is too controversial with the conclusions on causality and the relationship between these three concepts. Each country should have goals for the effective redistribution of wealth to promote growth. It encourages the State to invest further within different sectors: education, health, infrastructure, etc. It stimulates growth and reduces poverty.
In recent years, many empirical studies have attempted to examine the relationship between income inequality, poverty and economic growth. First, the studies note that poverty is measured by income, so there is a great connection between the two terms (Gelaw, 2009). By increasing the income of poor workers, one is able to reduce poverty. In this context, different studies have been developed to explore the complex relationship between income inequality and economic growth as well as poverty, which generate much debate in developing countries such as Tunisia.
According to the literature, the relationship between income inequality and GDP is very complex. It can be positive, negative, and it may be absent. Barro (2000) concluded that the effect of income inequality on growth might be positive or negative depending on the level of economic development. Income inequality in poor countries retards economic growth, while income inequality in rich countries stimulates growth.
2.1. The Relation between Growth and Inequality
The relation between these concepts is still arbitrary. Cogneau and Guenard (2002) examined how inequality and growth at the macroeconomic country level are related. They found no robust relationship from income inequality to economic growth and to the physical and human investment. However, Aghion and Howitt (1996) and Forbes (2000) and many other economists have shown a positive relationship between those variables.
Sbaouelgi and Boulila (2013) studied the causality between income inequality and economic growth for nine countries in the region of MENA for the period that runs from 1960 to 2011. They showed that there is long-term causality between economic growth and inequality for those countries: Tunisia, Iran, and Morocco. They also proved that growth has a positive effect on income inequality for Tunisia.
Some research shows that there is a negative causal relationship between the initial level of inequality and the growth rate in the long term. Dalton (1920) showed that inequality increases when there is an income transfer from a poor to a rich. This is the principle of transfer, which was initiated by Pigou in 1912 and was redesigned in 1920 by Dalton who insists that "This principle requires an increase in inequality consecutive to a transfer of income from the poorest to the richest, and a decline in inequality in the opposite case’’.
Another relevant study that found a negative relationship between inequality and growth is Deininger and Squire (1996). They argued about reducing poverty and promoting growth, so that governments start reinforcing their efforts to distribute the income with an egalitarian manner. Nasfi and Weriemmi (2014) studied the link between the triangle growth, inequality and poverty for Tunisia in the period, which runs from 1984 to 2011. The main results show that trade openness, financial development and capital humans have positive effects on economic growth. As for the inequality, the negative sign of the Gini coefficient reflects a negative effect of this variable on economic growth. Atkinson, Cantillon, Marlier, and Nolan (2002) who had showed the importance of income distribution in order to explain how the level of inequality has an impact on economic growth confirms this hypothesis.
Rajan (2010) is among the main supporters of the negative relation between inequality and growth. He argued that growing income inequality is a key factor leading to the financial crisis. Then there is a negative relationship between economic growth and income inequality.
2.2. The Relation between Poverty and Growth
Regarding the link between economic growth and poverty (Perotti, 1993) find that a high level of income allows the state to allocate more tax in different sectors such as health, education and social protection. This has a significant impact on reducing poverty. Ravallion and Chen (1996) estimate that reducing poverty related to high growth rate.
In addition, Lonnie and Sessions (2008) showed that during the phases of economic growth, the poverty rate is negatively related to economic changes for the United States. Piketty and Saez (2003) concluded that countries that are characterized by high rates of poverty and a high degree of income inequality could not benefit from economic growth.In this context, Hull (2009) emphasized the importance of job creation as a major channel for poverty reduction. Since, the quality and access of the poor to be employed are crucial determinants of poverty reduction. While economic growth is strongly linked to poverty reduction.
In the same line, Zaman, Khan, Ahmad, and Ikram (2011) indicated that there is a negative relationship between GDP and poverty. This means that the increase in GDP leads to increased production and therefore we speak of job creation. The latter has an impact on per capita income and in general on reducing poverty.
In Tunisia, Ayari et al. (2005) and Lahouel (2007) suggested that the component of growth as main factor in reducing the poverty rate continues from 1980 to 2000. The redistributive effect was generally low or had negative sign with economic growth. However, Bibi (2011) showed a positive relationship between growth and poverty for Tunisia.
Similarly, Sboui (2012) conducted a research in Tunisia from 1985 to 2005 to verify the relation between poverty and growth. The result confirmed that the rich have, proportionately, benefited more from the outcomes of growth than the poor have. Thus, growth has never been strictly pro-poor in Tunisia.
In addition, Aigbokhan (2000) conducted a research on the relationship between poverty, inequality and economic growth in Nigeria for the period 1986 to 1996. This economist explained the positive relationship between growth and poverty. In economic growth phase from 1986 to 1992, the level of poverty was doubled in the country. This result suggests that the phenomenon known as "trickle down", which supports the idea of growth reducing poverty and inequality, are not taken into consideration by the Nigerian data.
In addition, we find the study of Stephen and Simeon (2013) who conducted research on economic growth and poverty in Nigeria and they revealed that there is a positive relation between economic growth and poverty, implying that the improvement in economic policies did not reduce poverty.
According to Hassan (2015) the increase in the GDP growth rate for developing countries is accompanied by a high income inequality that increases the poverty. Whilst, for developed countries, the high rate of GDP generates low levels of income inequality and reduces poverty gap and, therefore, it stimulates economic growth.
Tanimu and Saifullahi (2014) examined the relation between growth, inequality and poverty in Nigeria using bound test of cointgration and granger causality test. They showed unidirectional causal relation running from GDP to poverty, which means that an increase in GDP in Nigeria causes high level of poverty.
2.3. The Relation between Inequality and Poverty
Is there a direct link between poverty and inequality? The results of empirical studies noted that inequality is important for the well-being of households so we should understand the impact of this variable (Wilkinson & Pickett, 2010).
Cheema and Sial (2012) showed a long-term relationship between the triangle of economic growth, poverty and income inequality in Pakistan for the periods between 1992-1993 and 2007-2008. After an economic growth period, the increase in GDP was accompanied by a general inequality of income during the initial stage in developing countries. Their result shows that inequality has a positive effect on poverty.
Kakwani (2001) and Son (2007) concluded that there is a positive relation between inequality and poverty. In addition, Alesina and Rodrik (1994) found that initial inequalities lead to lower growth and that contributes to accelerate poverty.
Similarly, Ravallion (1997) and Son and Kakwani (2004) have shown that a high levels of inequality, increased the poverty and will be more insensitive to economic growth.
Bourguignon (2003) developed a study in this line; he showed that reducing inequality causes poverty reduction. The main objective of Bourguignon (2003) was to study the countries' development strategies. The economist said that the reduction of poverty in a country is usually determined essentially by the growth rate of the average income of the population and the change in income distribution. Therefore, to rapidly reduce absolute poverty, countries must follow appropriate policies for growth and income distribution.
Lombardo (2008) shows how inequality plays positive and significant roles in affecting poverty for Italy.
3. Data Sources and Description of Variables
This study is based on annual time series data on real GDP, income inequality, and poverty rate over the period 1970–2013. The data are obtained from different sources. They were retrieved from the World Development Indicators World Bank (W.U.S) (2013) the basis of Deininger and Squire (1996) and the basis of SWIID. The missing values were supplemented by a simple interpolation between two successive points.
GRW |
POV |
INQ |
|
| Mean | 3.038121 |
61.78329 |
41.24509 |
| Median | 3.541258 |
61.73044 |
40.81500 |
| Maximum | 15.82633 |
68.15980 |
53.00000 |
| Minimum | -4.502137 |
57.81109 |
35.80000 |
| Standard deviation | 3.295923 |
2.070323 |
3.637896 |
| Observations | 44 |
44 |
44 |
| Source: Authors’ analysis. |
Our study aims to contribute to the literature by using data recently constructed for the inequality and poverty. It is based on the Gini index and the consumption per capita. The variables of interest in our model are the poverty rate, economic growth and income inequality. All variables are defined as follows:
Growth rate (GRW): We will choose to use the GDP growth rate per capita as a proxy for economic growth.
Inequality (INQ): is an important indicator when trying to deal with the development, welfare, living conditions and the impact of social and economic policies of population. In the empirical literature, the inequality of income is generally measured by the Gini index. The Gini coefficient is a statistical measure that allows us to measure of disparities in a given population. It is useful to synthesize the inequality of wages, income and level of life within a country. It varies between zero and one. If the Gini index is zero, then the distribution is perfectly egalitarian.
Poverty (POV): a number of indicators for measuring poverty have been proposed in the literature as the annual per capita income, the rate of population living under 1 or 2 dollars per day ... However, these indicators do not have some imperfections. The annual income per capita that has been used in some previous empirical studies does not account other dimensions of poverty. Furthermore, studies have shown that consumption expenditure for the poor is usually more stable than income (see (Ravallion, 1992; Woolard & Leibbrand, 1999)). For this reason, in our study we will use the consumption per capita as an indicator of poverty measurement (see also (Dhrifi, 2013; Odhiambo, 2009; Quartey, 2005)). We chose this proxy as an indicator of poverty measurement and not income because the actual consumption is more directly related to the welfare of a person in the sense that it better reflects the satisfaction of basic needs. In addition, it can reflect the real living standards of the household and its ability to cover its basic needs. As for income, it reflects only one of the elements that will allow the consumption of goods (Kpodar, 2006). Per capita consumption is provided by the World Bank. Descriptive statistics of all variables at their levels are presented in Table 1. The proxy of poverty is the market value of all goods and services purchased by households including payments and fees to governments (to obtain permits and licenses…). It includes imputed rent for owner-occupied dwellings. For example, the higher level of consumption in 2013 is 68.15% and the low one is in 1974, which is equal to 57.81%. This increase in the level of consumption is due to the growth of income.
4. Econometric Methodology and Empirical Results
4.1. Unit Root Tests
Before estimating the relation between our concepts, it is necessary to check the properties of time series. Non-stationary is common a property to the many macroeconomic and financial time series. Therefore, the first and important step in time series analysis is to check unit. There are different methods for unit root, as for example: Dicky Fuller (DF), Augmented Dicky Fuller (ADF) and Philip Perron (PP) test, Kwiatkowski–Phillips–Schmidt–Shin (KPSS) etc. Series which are stationary after being differentiated only once is integrated of order 1, whereas a series that appears stationary, without differentiation, is called I(0). In general, series are stationary after being differentiated n times are integrated of order n, noted I(n). After finding the order of integration of variables study, the next step is to decide about the cointegration technique. To study the relationship between growth, poverty and income inequality, we should test stationarity. ARDL bounds test is based on the assumption that the variables are I(0), I(1) or mix of both.
The results of the two tests applied to the levels and first differences of the variables are shown in Table 2 and Table 3.
Table 2 shows the results of the unit root tests ADF and PP of different series in level. According to the ADF test, we note that the GRW and INQ series are stationary in level: I(0). The PP test confirms the results of ADF only for GRW variable. Therefore, the economic growth variable is stationary in level. However, for the INQ, this test shows that there is a unit root. Therefore, the INQ variable is non-stationary in level. To eliminate this confusion, we move to another unit root test, which is the KPSS test with a null hypothesis of no unit root. This test well confirms the stationarity of the INQ series. Concerning the third variable ‘POV’, the result shows that is integrated of order 1, (I (1)).
| Variables | ADF test |
PP test |
||
t-stat |
Critical value at 5% |
t-stat |
Critical value at 5% |
|
| GRW | -6.41** |
-2.93 |
-6.417** |
-2.931 |
| POV | -2.23 |
-3.53 |
-3.09 |
-3.51 |
| INQ | -3.79** |
-3.53 |
-1.69/ 0.1a ** |
-1.94/0.14a |
| **Implies that coefficient is significant at 5% significance level. a : The results according to the unit root test KPSS. |
Table 3 gives the results of ADF and PP tests in first difference. According to the tests of ADF and PP the POV series is stationary in first difference. It is integrated of order 1.
We note that the series have different orders of integration and therefore we can run an ARDL approach.
| Variables | ADF test |
PP test |
Ordre d’intégration |
||
t-stat |
Critical value at 5% |
t-stat |
Critical value at 5% |
||
| POV | -2.04** |
-1.95 |
-9.366** |
-1.948 |
I(1) |
| INQ | --- |
--- |
-5.41** |
-1.94 |
I(1) |
| **Implies that coefficient is significant at 5% significance level. |
4.2. ARDL Bounds Testing to Cointegration
The main objective of cointegration is to discover the long-run relationship and the short-run interactions among variables. We applied the Autoregressive Distributed Lag (ARDL) model. Pesaran, Shin, and Smith (2001) developed this modeling approach.
Among the advantages of this technique: Firstly, it allows modeling series integrated of order differently but less than two. Secondly, to have a single simple equation to interpret so the system will automatically choose the appropriate number of lags. Then, this technique offer, in contrast to other methods, a new more efficient approach to use for obtaining the best-unbiased estimates of the long-term model, and it testing simultaneously for the long-run and short-run relationships. Finally, this approach is more efficient with small sample sizes as it is the case of most of the empirical studies of developing countries.
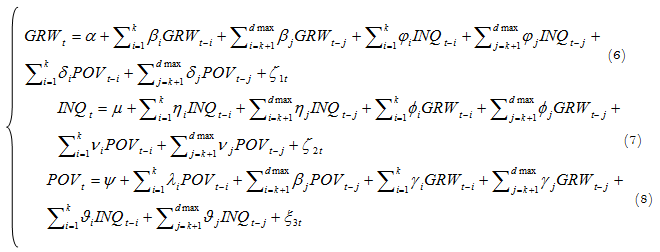
The ARDL equation is the following:
Where β, γ and ![]() shows short-run dynamics of the model and all θ’s shows the long-run relationship.
shows short-run dynamics of the model and all θ’s shows the long-run relationship.
The ARDL approach consists of two steps for estimation of the long-run relationship among variables. The application of F-statistic is the first step, in order to check if cointegration exists or not. This is called bound test. The bound test developed by Pesaran et al. (2001) is the Wald test. The null hypothesis of absence of long-run relationship between economic growth, poverty and inequality from the Equation 1 is written: H0: θ0 = θ1 =θ2 = 0. This assumption is examined by using the Wald statistic or the statistics of Fisher following a distribution that is not standard (Ghorbani & Motallebi, 2009). Under the alternative hypothesis, there is a co-integrating relationship between the three variables. Under the alternative hypothesis H1 : ![]() ≠ 0,
≠ 0, ![]() ≠0 et
≠0 et![]() ≠ 0.
≠ 0.
Two sets of critical values have been calculated by Narayan (2005) the upper bound critical values refers to the I(1) series and the lower bound critical values to the I(0) series. If the F-statistic exceeds the upper critical bound, then the null hypothesis of no cointegrating relation can be rejected. In the case when the F-statistic falls between the upper and lower bounds, a conclusive inference cannot be made. In the case, the F-statistic falling below the lower critical bound, we cannot reject the null of no cointegration.
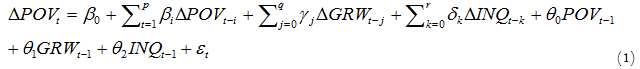
The ARDL procedure starts with determining of an appropriate lag order in Equation 1. This needs to implement the information criteria for selecting the lag-lengths. For this purpose, we used the Akaike Information Criterion (AIC). It is clear from the Graph 1, that the model ARDL(4,0,0) is the optimal model since it has the lowest AIC criterion (for more details see Belloumi (2014) and Belloumi and Alshehry (2015)).
Now, we move towards determining the cointegrating relationship among the variables. The results of the bound test indicate that the calculated F statistics 8.21 exceed the upper bound critical value (4.85) at 5 percent significance Table 4. It is clear that there is a long-run relationship between poverty, inequality and economic growth in Tunisia.
Bounds Testing for Cointegration |
|||
| F-statistic FGRW(GRW/POV,INQ) | F-statistic
8.21 |
Optimal lag length
(4,0,0) |
|
Critical Values |
|||
I(0) |
I(1) |
||
| 5% | 3.79 |
4.85 |
|
| Source: Authors’ analysis. |
After checking order of integration next step is to check long-run and short-run relationship among variables.
The long-run model can be estimated as:
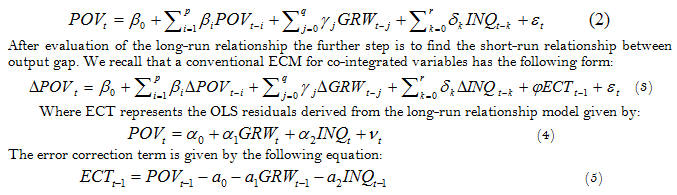
Table 5 shows the long-run and short-run error correction model. The results of long-run error correction model indicate that the adjustment parameter [ECT(-1)] shows negative and significant value, indicating the long-run convergence. This coefficient reveals that about 44% of the disequilibrium in the poverty rates in Tunisia is reported with other independent variables.
According to Table 5, there is a negative relation between inequality and consumption per capita. If inequality decreases by 1 percentage point, consumption per capita increases of 0.87 points, and, therefore, poverty decreases. Inequality has a positive effect on poverty in the long term. This coefficient shows the direct and significant impact of this indicator on the reduction of poverty in Tunisia. Our result is consistent with results of Cheema and Sial (2012); Ravallion and Chen (1996) and Lombardo (2008); Kakwani (2001) and Son (2007); Bourguignon (2003) and Son and Kakwani (2004) as well as Hassan (2015).
However, economic growth has no impact on poverty. This result confirms assumption of Englert (1998) and Nomaan (2011). We can explain this result by the lack of a law linking of GDP with poverty. This result also confirms also the hypothesis of Hanmer and Naschold (2000) who suggested that the least developed countries will not able to reduce poverty through growth alone, but there are types of policies and strategies to reduce poverty. While poverty is linked to political choices that differ from one country to another.
The results of the short-run estimation suggest that the results of long-run are the same in the short-run, for the inequality. Therefore, we have a positive relation between poverty rates and inequality: Hassan (2015). The growth also has a positive relation with poverty. Past work has shown that a given rate of economic growth reduces poverty. Indeed, an increase growth rate of 1 percentage point results in a decrease of 0.28 points of consumption and, therefore, poverty increases. This implies that economic growth rate does not reduce poverty in Tunisia. This result is similar to the findings of Aigbokhan (2000); Bibi (2011); Tanimu and Saifullahi (2014); Stephen and Simeon (2013); Sboui (2012). This is the result of a high inequality level in the developing country (Bourguignon, 2004). Finally, it was noted that the type of growth in recent years in our country seems to benefit more for the rich than the poor. We can say that the growth has a negative effect in reducing poverty for a country with a higher degree of inequality.
Therefore, it should be noted that there are other factors that must all meet to minimize this concept: inflation rate, population growth rate, investment, the role of social funds.
| Long-run regression | [dependent variable: POV] |
||
| variables | Coefficient |
t-stat |
Probability |
| GRW | -0.63 |
-1.33 |
0.19 |
| INQ | -0.87 |
-2.02 |
0.05 |
| Constant | 98.7 |
5.3 |
0.00 |
| ECM model | |||
| D(POV(-1)) | -0.14 |
-0.67 |
0.5 |
| D(POV(-2)) | -0.04 |
0.23 |
0.81 |
| D(POV(-3)) | -0.13 |
-0.92 |
0.36 |
| D(GRW) | -0.28 |
-2.82 |
0.008 |
| D(INQ) | -0.39 |
-3.47 |
0.001 |
| CointEq(-1) | -0.44 |
-1.86 |
0.07 |
| Source: Authors’ analysis. |
Once the ECM model given by Equation 3 has been estimated, we must examine the stability of the long-run coefficients together with short-run dynamics in order to determine the goodness of fit of the ARDL model. All Diagnostic tests for serial correlation (Durbin Watson test and Breusch–Godfrey test), heteroskedasticity (Breusch-Pagan-Godfrey heteroskedasticity test), and normality of errors (Jarque–Bera test) test also were conducted and the results are shown in Table 6. The results indicate that the p-value associated with the Jarque-Bera statistic is greater than 5%, allowing us to validate residual normality assumption. There is no suspicion of serial correlation among variables and there is no evidence for heteroscedasticity as well.
| Test diagnostic | F-stat |
Probability |
| Normality test (Jarque–Bera test) | 0.8 |
0.66 |
| Heteroskedasticity test | 0.80 |
0.57 |
| Breusch–Godfrey serial correlation test | 1.69 |
0.2 |
| Source: Authors’ analysis. |
The cumulative sum of recursive residuals (CUSUM) and the CUSUM of square (CUSUMSQ) tests are applied also. Figure 2 and Figure 3 plot the long-run stability of the model. The results indicate the absence of any instability of the coefficients because the plot of the CUSUM and CUSUMSQ statistic represent critical bounds at 5% significance level.
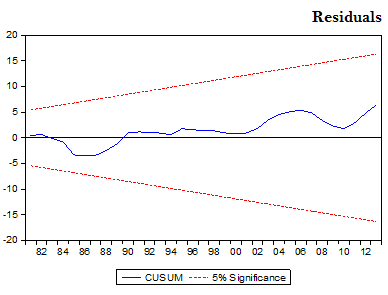
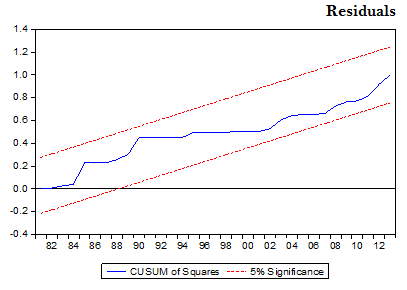
Following these tests, we can conclude that our error correction model is validated, the results of diagnostic tests show that the residues satisfy all the assumptions of the linear model and our model is stable over time.
The aim of the last step is to resolve the causality issue between poverty economic growth and income inequality.
4.3. Toda and Yamamoto Causality Test
The objective of our study aims to identify the causal relationships between economic growth, poverty and income inequality. As well, the knowledge of the causality between the economic variables used to provide important elements for the implementation of economic policies adequate. For this reason and to better highlight the relationship in the short term between these variables better, the test of Toda and Yamamoto (1995). This test ignores the condition of stationary or cointegration of the series to test the causality. The basic idea of this approach is to increase the order of VAR adjusted, k, by the maximum order of integration, said the dmax. The test of Toda and Yamamoto (1995) is a test of no Granger causality.
The Assumptions of Toda and Yamamoto:
Concerning the Equation 6:
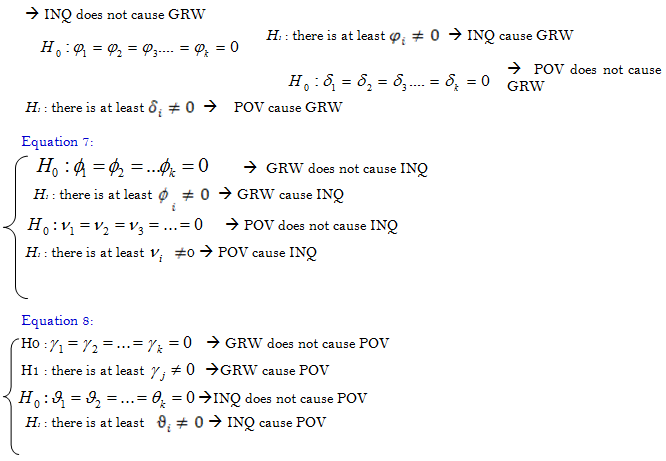
According to Table 7, the results of the tests are in favor of unidirectional causality between economic growth and poverty. In other words, in the case of Tunisia, the statistical significance of χ² and t-statistics at the 5% level show that economic growth cause poverty. This supports the assumption of Tanimu and Saifullahi (2014).
The same for the relation between poverty and inequality, according to the approach of Toda and Yamamoto, the existence of this unidirectional relationship is verified. The poverty causes income inequality in Tunisia.
In the case of Tunisia, the evidence is in favor of bidirectional causality between the proxy of income inequality and the growth rate of GDP per capita at 10% level. So, we can assume that inequality also affects poverty indirectly through its impact on growth. This result is affirmed by Sbaouelgi and Boulila (2013) and Sbaouelgi (2014).
| Null Hypothesis | Probability |
χ² stat |
Decisions |
| GRW does not cause POV POV does not cause GRW GRW does not cause INQ INQ does not cause GRW POV does not cause INQ INQ does not cause POV |
0 0.86 0.051 0.01 0.01 0.34 |
11.34 0.02 3.81 5.61 6.45 0.88 |
Reject H0 : Existence of causality Accept H0 : Absence of causality Reject H0 : Existence of causality Reject H0 : Existence of causality Reject H0 : Existence of causality Accept H0 : Absence of causality |
| Source: Authors’ analysis. |
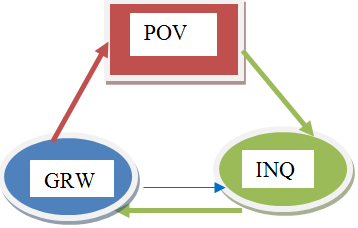
Political leaders should focus their efforts on the poorest and the middle class to reduce inequality. In Tunisia, to promote growth and reduce poverty, government must strengthen its efforts to distribute income of an egalitarian manner. The following chart summarizes the different direction of causality:
5. Conclusions
There is a conflicting viewpoint about the relation and the causal impacts of inequality and growth on poverty. This study has investigated the nature and the direction of causality between poverty, economic growth and income inequality. The result of bounds testing for cointegration shows that there exists long-run relationship among variable in Tunisia by using annually data for the period 1970 to 2013. In long term, we conclude that economic growth does not seem to affect poverty. However, growth is positively related to poverty in the short term. The poor might suffer more from economic growth in the short term especially in high inequality countries.
In the other hand, Toda and Yamamoto (1995) test is applied for testing the causality between this triangle. In examining the causal relation, the result shows that there is a unidirectional causal relationship running from economic growth to poverty. The result further reveals the existence of unidirectional causal relation between poverty and income inequality. However, we found a bidirectional causality between the proxy of income inequality and the growth rate of GDP per capita.
Throughout this critical reading, it turned out, referring to theoretical and empirical analyzes mentioned above, that decline in poverty depends primarily on strong economic growth and countries must follow appropriate policies for income distribution. However, if the findings of empirical studies are not always the same, it is possible to state that growth alone is not enough to reduce poverty.
The empirical evidence presented above has important implications for the conduct of economic policies in our country. Indeed, despite the results of the study, in Tunisia, development strategies should keep in mind the fact that the fight against poverty and reduce income inequality are always a priority.
References
Aghion, P., & Howitt, P. (1996). Research and development in the growth process. Journal of Economic Growth, 1(1), 49-73.
Aigbokhan, B. E. (2000). Poverty, growth and inequality in Nigeria: A case study. African Economic Research Consortium Research Report. pp: 1-4.
Alesina, A., & Rodrik, D. (1994). Distributive politics and economic growth. Quarterly Journal of Economics, 10(2), 465-490.
Atkinson, T., Cantillon, B., Marlier, E., & Nolan, B. (2002). Social indicators: The EU and social inclusion. Oxford: OUP.
Ayari, F., Srasra, E., & Trabelsi-Ayadi, M. (2005). Characterization of bentonitic clays and their use as adsorbent. Desalination, 185(1-3), 391-397. Available at: https://doi.org/10.1016/j.desal.2005.04.046 .
Barro, R. J. (2000). Inequality and growth in a panel of countries. Journal of Economic Growth, 5(1), 5-32.
Belloumi, M. (2014). The relationship between trade, FDI and economic growth in Tunisia: An application of the autoreressive distributed lag mode. Journal of Economic Systems, 38(2), 1-19.
Belloumi, M., & Alshehry, A. (2015). Sustainable energy development in Saudi Arabia. Journal of Sustainability, 7(5), 5153-5170.
Bibi, S. (2011). Poverty and inequality in Tunisia, Morocco and Mauritania, African development bank. Economic Brief Afdb.
Bourguignon, F. (2003). The growth elasticity of poverty reduction: Explaining heterogeneity across countries and time periods, in: T. Eicher and S. Turnovsky, eds. Inequality and growth. Theory and Policy Implications. Cambridge: The MIT Press.
Bourguignon, F. (2004). The poverty-growth-inequality triangle. A Paper Presented at the Indian Council for Research on International Economic Relations, New Delhi.
Cheema, A. R., & Sial, M. H. (2012). Poverty, income inequality, and growth in Pakistan: A pooled regression analysis. Lahore Journal of Economics, 17(2), 137– 157.
Cogneau, D., & Guenard, C. (2002). Les inégalités et la croissance une relation introuvable. DT (pp. 1-26). Paris: DIAL.
Dalton, H. (1920). The measurement of the inequality of incomes. Economic Journal, 30(119), 348-361.
Deininger, K., & Squire, L. (1996). Measuring income inequality: A new database. World Bank Economic Review, 10(3), 565-591.
Dhrifi, A. (2013). Financial development and poverty: What role for growth and inequality? International Journal of Academic Research in Accounting, Finance and Management Sciences, 3(4), 119–129.
Englert, M. (1998). The impact of economic growth on poverty and inequality (pp. 1-182): Published in the journal l'Observatoire n ° 58, under the title: The Impact of Economic Growth on Poverty and Inequality: The Importance of Political Choices.
Forbes, K. (2000). A reassessment of the relationship between inequality and growth. American Economic Review, 90(4), 869-897.
Gelaw, F. (2009). The relationship between poverty, inequality, and growth in the rural Ethiopia: Micro evidence. Paper presented at the A Paper Presented at the International Association of Agricultural Economists Conference, Beijing, Chinal.
Ghorbani, M., & Motallebi, M. (2009). Application Pesaran and Shin method for estimating Irans` import demand function. Journal of Applied Sciences, 9(6), 1175-1179.
Hanmer, L., & Naschold, F. (2000). Attaining the international development targets: Will growth be enough? Development Policy Review, 18(1), 11- 36.
Hassan, S. A. (2015). The relationship between growth-inequality-poverty triangle and environmental degradation: Unveiling the reality. Arab Economics and Business Journal, 10(1), 57–71.
Hull, K. (2009). Understanding the relationship between economic growth, employment and poverty reduction, – OECD, promoting pro-poor growth – employment, development co-operation directorate (pp. 69-91). Paris: OECD.
Kakwani, N. (2001). On specifying poverty lines. Paper Presented at the Asia and Pacific forum on poverty (pp. 1-34): Reforming Policies and Institutions for poverty Reduction, Asia Development Bank, Manila.
Kpodar, K. (2006). Financial development and poverty reduction: Can there be a benefit without a cost? IMF Working Paper, African Department CERDI, Clermont Ferrand (France). pp: 1-38.
Lahouel, M. H. (2007). The success of pro-poor growth in rural and urban Tunisia, In T. Besley and L. J. Cord (eds.), Delivering on the Promise of Poor Growth (pp. 199-218): Insights and Lessons from Countries Experiences. Palgrave Macmillan and the World Bank.
Lombardo, V. (2008). Growth and inequality effects on poverty reduction in Italy, Discussion Paper No. 9, Department of Economic Studies, University of Naples, Italy. pp: 1-36.
Lonnie, K. S., & Sessions, D. (2008). The relationship among poverty, economic growth, and inequality revisited. Journal of Income Distribution, 17(1), 5-20.
Narayan, P. (2005). The saving and investment nexus for China: Evidence from cointegration tests. Applied Economics, 37(17), 1979–1990.
Nasfi, W., & Weriemmi, M. (2014). The relationship between economic growth and income inequality. International Journal of Economics and Financial Issues, 4(1), 135-143.
Nomaan, M. (2011). What has really happened to poverty and inequality during the growth process in developing countries, Employment Sector, Employment Working Paper No.96? (pp. 1-45). Economic and Labor Market Analysis Department, ILO.
Odhiambo, N. M. (2009). Finance-growth-poverty nexus in South Africa: A dynamic causality linkage. Journal of Socio-Economics, 38(2), 320-325.
Perotti, R. (1993). Income distribution and investment. European Economic Review, 38(3-4), 827-835.
Pesaran, M. H., Shin, Y., & Smith, R. J. (2001). Bounds testing approaches to the analysis of level relationship. Journal of Applied Economics, 16(3), 289–326.
Piketty, T., & Saez, E. (2003). Income inequality in the United States, 1913-1998. Quarterly Journal of Economics, 118(1), 1-39.
Quartey, P. (2005). Financial sector development, savings mobilization and poverty reduction in Ghana, UNU-WIDER, Research Paper No (pp. 1-32). 2005/71, United Nations University, Helsinki, Finland.
Rajan, R. (2010). Fault lines: How hidden fractures still threaten the world economy. Princeton: Princeton University Press.
Ravallion, M. (1992). Poverty comparisons: A guide to concepts and methods. Living Standards Measurement Study Working Paper 88. Washington DC: World Bank. pp: 1-138.
Ravallion, M. (1997). Can high-inequality developing countries escape absolute poverty? Economic Letters, 56(1), 51-57.
Ravallion, M., & Chen, S. (1996). What can new survey data tell us about recent changes in distribution and poverty? World Bank Economic Review, 11(2), 357–382.
Sbaouelgi, J. (2014). The causality between income inequality and economic growth: Case of Tunisia, Jordan, Taiwan and Japan. European Journal of Business and Social Sciences, 3(3), 169-177.
Sbaouelgi, J., & Boulila, G. (2013). The causality between income inequality and economic growth : Empirical evidence from the Middle East and North Africa region. Asian Economic and Financial Review, 3(5), 668-682.
Sboui, F. (2012). Effects of growth and inequality on poverty in Tunisia. Region and Development No. 35, 58-80.
Son, H. (2007). Interrelationship between growth, inequality, and poverty: The Asian experience. Asian Development Review, 24(2), 37-63.
Son, H., & Kakwani, N. (2004). Economic growth and poverty reduction: Initial conditions matter, working paper No. 2, Brasilia (pp. 1-29). United Nations Development program.
Stephen, B. A., & Simeon, I. A. (2013). Does economic growth reduce poverty in Nigeria? Developing Country Studies, 3(9), 62 – 68.
Tanimu, N., & Saifullahi, S. I. (2014). An empirical study on the relationship between poverty, inequality and economic growth in Nigeria. Journal of Economics and Sustainable Development, 5(26), 20-24.
Toda, H. Y., & Yamamoto, T. (1995). Statistical inference in vector auto-regressions with possibly integrated process. Journal of Econometric, 66(1-2), 225-250.
Wilkinson, R., & Pickett, K. (2010). The spirit level: Why equality is better for everyone. Journal of Social Policy, 42(4), 840-884.
Woolard, I., & Leibbrand, T. M. (1999). Measuring poverty in South Africa. In Bhorat, H, Leibbrandt M, Maziya M, Van der Berg S, and Woolard I (pp. 1-45). Fighting poverty: labor markets and inequality in South Africa. Lansdowne: UCT Press.
World Development Indicators World Bank (W.U.S). (2013). Retrieved from http://www.worldbank.org/data/onlinedatabases/onlinedatabases.html .
Zaman, K., Khan, M. M., Ahmad, M., & Ikram, W. (2011). Inflation, unemployment and the NAIRU in Pakistan (1975-2009). International Journal of Economics and Finance, 3(1), 245–254.
Footnotes:
1. Source: Surveys on the budget and consumption of households INS: 1980, 1985, 1990, 1995, 2000.
2. Source: National Institute of Statistics, 2010 National Expenditure Survey, consumption and living standards of households.
3. The Director of Demographic and Social Statistics at the National Institute of Statistics (NIS)