Cannabis Stock behavior and Investor’s Expectations on the TSX: A Mixed Method Approach
Oludamola Durodola1*
Deepika Chotee2
1,2School of Business, Lakeland College Lloydminster T9V 3N7, Canada |
AbstractThis study examines the behavior of cannabis stock on the Toronto Stock Exchange and why investors are interested in cannabis stock. The theory of heterogeneous beliefs, bounded rationality theory and the theory of addiction grounded the study. We employed basic descriptive statistics and the Kruskal-Wallis test including an in-depth interview of investors using convenience sampling methods. The study findings showed that cannabis stocks exhibit a higher-level of risk volatility when compared to speculative and growth stocks on the Toronto Stock Exchange within the period under investigation. The descriptive statistics result suggest potential diversification benefits between cannabis stocks and growth stocks as both stocks classifications are likely to respond to macroeconomic shocks differently. Other findings show that cannabis stocks share similar characteristics with other speculative stocks but also possess unique features. Finally, investors are interested in cannabis stocks because of its potential for future strong earnings on the platform of the theory of addiction as discussed in the study. |
Licensed: |
|
Keywords: |
|
Accepted: 28 June 2019 |
|
| (* Corresponding Author) |
Funding: This study received no specific financial support. |
Competing Interests:The authors declare that they have no competing interests. |
1. Introduction
In 2001, Canada became the first country to legalize Cannabis for medical purposes. This was passed into law through the Marijuana Medical Access Regulations (MMAR) Acts (Greenline POS, 2019). The passing of this bill into law ushered in a plethora of pharmaceutical firms interested in developing medications derived primarily from Cannabis compound. According to Statistics Canada, Cannabis pharmaceutical industry is worth around $400 million as at 2017 (Statistics Canada 2019). Medical scientists suggest that a typical cannabis plant possess 113 Cannabinoids of which two are currently most useful; psychoactive tetrahydrocannabinol (the component that make people feel high), and non-psychoactive cannabidiol (CBD, the non-intoxicating compound responsible for calming people down) (Globe & Mail, 2019).
Scientists overtime based on their understanding of how the human brain responds to Cannabis have developed medications which are derivatives of cannabis compounds to alleviate human sufferings by mitigating the effects of certain ailments. For instance medical cannabis have been developed for the treatment of neuropathic pain, spasticity in patients with multiple sclerosis, analgesic treatment of adult with cancer, treatment of nausea, appetite stimulant for patient with HIV, regaining memory loss, treatment of traumatic brain injury etc. (Medicalmarijuana.ca, 2019).
On the basis of the successes recorded in the pharmaceutical industry coupled with a thriving illegal use of recreational cannabis in the black market, the government initiated and approved the bill allowing recreational cannabis. On October 2018, Canada became the first Country amongst the G7 nations to legalize the sale, and the use of recreational cannabis (Statistics Canada (2019)). Currently, approximately 4.9 million Canadians use cannabis for recreational purposes, with the potential to grow much more now that it is legal and trending. Economists project that the recreational cannabis industry will grow to $6.8 billion by 2020.
Considering that the cannabis industry is poised to thrive on the background of proven medical and recreational benefits, a number of firms have become active on the Toronto Stock Exchange (TSX) in recent times. These firms in a bid to expand production and gain share, have invested quite a lot of money in research and development hoping to come up with innovative products that could give them a competitive edge in a potentially lucrative and emerging industry. According to 2019 data, there are 21 active cannabis stocks trading on the TSX with total market capitalization of $50.8 billion.
Against the foregoing discussion, this study empirically examines the behavior of cannabis stocks on the TSX, and in addition explores why investors are interested in these stocks. This inquiry is important knowing that most if not all of these firms have very thin or non-existent historical fundamentals needed to determine their earnings potentials and future prospects. The rest of the paper is as follows; section ii, we explore the theoretical literature and the empirical literature regarding the theory of heterogeneous beliefs, section iii we highlights the study purpose and pertinent research questions, section iv, we provide a description of research methods and finally, we discuss data analysis and results.
2. Theoretical Framework and Empirical Analysis
This analysis is an assortment or a mixed analysis of, otherwise reflecting a cocktail of related theories in support of the discussion on cannabis use, cannabis revenue or earnings, cannabis stock behavior and, ultimately future cannabis stock price expectations. Our theoretical framework establishes a strong link between the theory of heterogeneous beliefs, bounded rationality theory and the theory of addiction.
The earliest work on the theory of heterogeneous beliefs was proposed by Lintner (1969). The theory of heterogeneous beliefs or expectations acknowledges that economic agents possess different future expectations regarding stock prices, and as such make different decisions in the current period. Economic agents are adjudged to have different prior knowledge leading to different future expectations (Allen & Gale, 1999; Morris, 1996).
A variant of the theory of heterogeneous expectations suggests that economic agents receive homogenous information but surprisingly produce different or heterogeneous expectations (Harris & Raviv, 1993; Miller, 1977). Brock and Hommes (1997) argued that investors have consistent heterogeneous beliefs about underlying market fundamentals, and therefore holds heterogeneous beliefs about the future returns on asset prices.
Other studies showed that heterogeneous beliefs is dynamic or nonstationary in nature due to ongoing access to new information, resulting in changing beliefs over a period (Detemple & Murthy, 1994; Scheinkman & Xiong, 2003). Investors develop heterogeneous future expectations based on information gleaned from a variety of sources and the interpretation assigned to the information obtained (Allene, Vincent, Alsop, Ismail-zadeh, & Flecker, 2003; Dumas, Kurshev, & Uppal, 2009; Lam & Xiao, 2000). Interpretation however is based on prior knowledge and investment objective (Morris, 1996; Xiong, Zhou, & Varshney, 2010). Brocke, Lakonishok, and LeBaron (1992) showed that heterogeneous beliefs is a significant factor causing asset price volatility wherein investors are constantly changing their position in the market due to consistent changes in future expectations. Invariably, heterogeneous beliefs could lead to stock price overvaluation or a higher trading frequency otherwise known as churning (LeBaron et al., 1995; Sethi, 1996).
De Long, Shleifer, Summers, and Waldmann (1990) indicated that the prospects of a firm stock price could be observed from the valuation optimist traders attach to it contending that pessimists would rather stay away from investing. Speculative investor behavior is reflected based on heterogeneous beliefs and trading behavior (Allenp & Gillooly, 2006). Heterogeneous belief theory also holds that investors identify a finite set of information alluding to how future asset prices should behave and therefore update their expectations in a bounded rational way (Harris & Raviv, 1993; Wang et al., 2004). The bounded rationality theory establishes that investors are limited in their drive to make rational decisions that could deliver maximum satisfaction (Simon, 1956). This limitation is evident based on limited access to relevant information, limited cognitive ability, and limited information processing skills (Conlisk, 1996) investors will rather settle for a satisficing solution instead of aiming for an optimal solution.
Cannabis industry stands a good chance of thriving on the basis of its supposedly recreational benefits which are also addictive in nature. According to the biopsychological theory of addiction, addiction involves intense cravings which eventually translate to a persistent pattern of compulsive consumption of the substance addicted to (Robinson & Berridge, 1993). Substance consumption translates gradually to a compulsive substance use pattern over a period time.
Becker and Murphy (1998) linked addiction to the theory of rational choice indicating that people get addicted to different things in their quest to satisfy their rational cravings. Addiction could manifest in form of alcohol, cocaine, eating, work, music, television, lifestyles, religion and a host of other activities. Once a habit is formed translating to addiction, the individual concerned finds it extremely difficult to break out of the already formed pattern. The pattern will have to be observed no matter the cost whether it is affordable or not.
Donegan, Rodin, O'Brien, and Solomon (1983) however, identified a distinction between harmful addiction and beneficial addiction noting that most harmful addiction cases requires that current consumption of the addictive substance be greater than the previous level of consumption. The consequences in this case may be life threatening. On the other hand, beneficial addiction could just be the case where a persistent consumption pattern level is maintained over time.2.1. Study Purpose and Research Questions
Scheinkman and Xiong (2003) indicated that heterogeneous beliefs regarding speculative stocks could inflate and create a bubble leading to increased trading volume and extreme price volatility. On the basis of the forgoing discussion, this study examines the behavior of cannabis stocks on the Toronto Stock Exchange (TSX). The study tries to answer the following questions;
- What are the unique features of Cannabis stock behavior on the TSX?
- Are Cannabis stocks similar to other speculative stocks on the TSX?
- Why are investors buying cannabis stocks on the TSX?
3. Research Methodology
3.1. Kruskal-Wallis Test
This paper uses one core methodology to perform the analysis, the Kruskal-Wallis Test. This test is suitable for an analysis of this nature due to the characteristics of the data being analyzed and the analytical attributes of each test applied. The Kruskal Wallis test was used to analyze the time series data acquired for this study. The Kruskal – Wallis test is typically used when more than two independent samples are being compared (Sharpe, Velleman, & Wright, 2018). In situations where the data set is too small consisting of non-numeric data, and the distribution does not appear to be normally distributed, the Kruskal-Wallis test is a suitable alternative to parametric tests. Hecke (2010) showed that the Kruskal-Wallis test represents a non-parametric approach to investigating two or more populations without the assumption about normality. While setting the hypotheses, the null hypotheses should indicate that the samples are obtained from identical populations.
The Kruskal-Wallis Test requires the same assumptions as the Wilcoxon Rank Sum (Mann-Whitney) Test (Sedgwick, 2014) which are listed below:
- The sample of observations have to be independent
- The two samples have to be independent
The Kruskal-Wallis Test uses the following hypotheses in constructing the test:
H0: The samples belong to the same distribution
HA: At least one of the samples belongs to a distribution that has shifted higher or lower
Each data value in the samples used is assigned a rank. The sum of the ranks is then calculated to obtain:
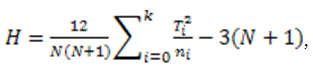
Where Ti are the sum of the ranks of each sample, ni is the number of data values in the ith sample, k is the number of samples, and N is the total number of values.
The null hypothesis H0 is rejected if H > χ2 , with k - 1degrees of freedom,
Where χ2 is the chi-squared distribution with degrees of freedom equal to the number of samples minus one.
Prior studies that have used the Kruskal Wallis test have found its effectiveness in analyzing independent samples, as is the case in the current analysis (Sedgwick, 2014). The Kruskal-Wallis test has the ability to test multiple samples and has proven relatively accurate in highlighting any shifts in one or more of the samples considered. Hecke (2010) however noted that the Kruskal-Wallis approach rests on the assumption that the samples be taken from populations having similar shape of distribution. If this assumption is violated, the test result could be spurious.
3.2. In-Depth Interview
The in-depth interview process involves an elaborate interaction with research subjects, which could be structured, semistructured, or unstructured based on the level of pre-arranged set of questions intended (Janesick, 2011). We utilized the semistructured option because it encourages a blend of flexibility and structure preferred by the researcher. We selected participants in this study via convenience sampling method. Teddlie and Tashakkori (2009) indicated that convenience sampling is not random; it involves a selection of units of analysis based on a convenience and qualifying factors. In this case, we targeted individuals who have invested or planned to invest in cannabis stock on the TSX.
4. Data Analysis and Results
In order to observe the comparative descriptive characteristics of cannabis stocks, alongside large cap growth stocks on the Toronto Stock Exchange (TSX), we obtained daily closing prices for one large cap stock (RBC), one large cap cannabis stock (Aurora), all on the TSX for the period March 12, 2018 to March 12, 2019, a total of 252 observation. For the Krukal-Wallis test we obtained daily closing prices for four speculative stocks (GDNP, GGM, TETH, PWM) and two cannabis stocks (Canopy and Dutchman) for the period March 12, 2018 to March 12, 2019. From Table 1 below, the paired sample descriptive statistics involving RBC and Aurora showed that RBC exhibited a higher measure of standard deviation, however the average BETA and the coefficient of variation obtained for the two stocks showed contrary results. While RBC showed a modest amount of volatility of 0.92, Aurora produced an average beta of 2.80 indicating higher level of risk relatively. In addition, Aurora coefficient of variation showed that standard deviation is 18.72 percent of the mean, while RBC produced a coefficient of variation of 3.20. Evidence from both the Beta coefficient and the coefficient of variation showed Aurora as possessing higher risk relative to RBC. The coefficient of variation is helpful when using the risk/reward ratio when implementing stock selection for a portfolio. An investor who is risk-averse may consider stocks with a historically low degree of volatility or low coefficient of variation, and a high degree of return. Conversely, risk-seeking investors may be attracted to assets with a historically high degree of volatility or higher level of coefficient of variation.
| Listed Firms | Mean |
N |
Std. Deviation |
Std. Error Mean |
Coefficient of Variation |
BETA coefficient |
|
| Aurora | 8.918095 |
252 |
1.6690824 |
.1051423 |
18.72 |
2.80 |
|
| RBC | 99.421944 |
252 |
3.1764022 |
.2000945 |
3.20 |
0.92 |
|
| Source: Estimation obtained from SPSS & Yahoofinance. |
From Table 2 below, pairwise correlation coefficient of 0.372 between the two stocks showed a weak form of strength of association indicating potential diversification benefit when the two stocks are included in a portfolio. The two stocks are likely to respond to macroeconomic shocks differently.
| Listed Firms | N |
Correlation |
Sig. |
|
| Pair 1 | Aurora & RBC | 252 |
.372 |
.000 |
| Source: Estimation obtained from SPSS. |
Table 3 below, illustrates the descriptive statistics for four speculative stocks and two cannabis stocks. With the exception of PWM stocks, the two cannabis stocks demonstrated greater volume of volatility or risk level in terms of coefficient of variation and beta coefficient. Going by standard deviation and data range, Canopy and Dutchman possess a higher level of volatility when compared with the other four speculative stocks. This observation confirms the theory of heterogenous belief. According to Brocke et al. (1992) heterogeneous beliefs is a significant factor influencing asset price volatility, a situation where investors are constantly changing their position in the market due to consistent changes in future expectations. This observation further showed that cannabis stocks possess a unique characteristics of risk level different from typical speculative stocks.
| Listed Firms | N |
Mean |
Std. Deviation |
Minimum |
Maximum |
Coefficient of variation |
Beta Coefficient |
| GDNP | 201 |
.117687 |
.0142213 |
.0900 |
.1500 |
12.08 |
0.37 |
| GGM | 201 |
.17421852 |
.036018779 |
.116487 |
.268817 |
20.67 |
0.11 |
| TETH | 201 |
.21746 |
.045423 |
.140 |
.350 |
20.89 |
1.98 |
| PWM | 201 |
.3662 |
.15473 |
.16 |
.68 |
42.25 |
1.46 |
| Canopy | 201 |
43.1018 |
12.26895 |
25.74 |
73.75 |
28.47 |
4.76 |
| Dutchman | 201 |
4.7826 |
1.68389 |
1.35 |
8.78 |
35.21 |
1.63 |
| Source: Estimation obtained from SPSS & Yahoofinance. |
The variables under investigation exhibit different shapes and as a result the Kruskal-Wallis H test was utilized to help analyze their mean ranks. Figure 1 in the appendix produced 8 ranks for each of the variables analyzed. In addition, from Table 4 below, our test statistics tagged Chi-square is known as Kruskal-Wallis H. A larger value is evidence that larger differences exists between the variables under investigation. Asymp, Sig as indicated in Table 4 below is the p-value based on our chi-square approximation. From Table 4 below, the Kruskal-Wallis H test statistics is 112.702, 84.432, 45.977, 83.599 and 89.398 for stocks GDNP, GGM, TETH, PWM and Canopy respectively. These highlighted large values further confirms that there exists significant differences between the variables in the group. The p-value is less than 1 per cent and 5 percent respectively which proves that the difference in mean ranks among the variables are statistically significant. We therefore reject the null hypothesis that the samples were taken from identical populations and accept the alternative that the samples were not chosen from identical populations.
| Listed Firms | GDNP |
GGM |
TETH |
PWM |
Canopy |
| Chi-Square | 112.702 |
84.432 |
45.977 |
83.599 |
89.398 |
| df | 7 |
7 |
7 |
7 |
7 |
| Asymp. Sig. | .000 |
.000 |
.000 |
.000 |
.000 |
| a. Kruskal Wallis Test b. Grouping Variable: Dutchman. |
Five respondents were interviewed as to why they would invest in cannabis stock knowing that most of the firms lack fundamentals that could provide a basis for analysis. The consistent data gathered across the five respondents showed that because recreational cannabis possess addictive tendencies, addictive spending pattern will follow and as a result active cannabis consumer will ensure that sales stay consistent and when earnings is regular, share price will appreciate accordingly.
5. Conclusion
This paper set out to analyze certain key aspects of cannabis stock relative to other stocks on the TSX as well as their perceived value to investors. Canada recently legalized the recreational use of cannabis, which is in addition to an existing thriving legal exploration of medical cannabis within the Canadian pharmaceutical industry. Webster (2018) indicated that 11 per cent of Canadian youths and adult consume approximately 700 tons of cannabis annually. This data which promises to improve over time has also triggered fresh entrepreneurial drive in the private sector of the economy. Recent data showed that a sizeable number of firms are increasingly becoming very active on the Toronto Stock Exchange hoping to raise capital to finance aggressive growth and research campaigns. This trend falls on the premise that the cannabis industry promises to deliver on aggressive earnings growth because of its both medical and recreational benefits. This study used a combination of statistical modelling and interviews of target investors to analyze the data. The main research questions of the paper centered on the uniqueness of cannabis stock behavior on the TSX, the similarities of these stocks relative to speculative stocks on the TSX and the reason behind investors’ decision to invest in cannabis stock. This study showed that Cannabis stocks on average possess higher level of risk when compared with growth and speculative stocks on the TSX. This observation aligns well with the theory of heterogenous beliefs causing extreme volatility in the market (Brocke et al., 1992).
In addition, this study showed that investors are buying cannabis stocks because of its addictive tendencies hoping that addictive purchases of cannabis products will guarantee consistent flow of revenue and earnings for firms in the industry. Against the background of the positive implication of the cannabis industry for the Canadian economy, it is important to examine the health implications of recreational cannabis on the society. Webster (2018) argued based on a report by the Association des Médecins Psychiatres du Quebec, a group representing over 1200 psychiatrists in Quebec that cannabis consumption could cause psychotic disorder such as schizophrenia. In the same vein, the Canadian cancer society has warned that cannabis consists of chemical compounds capable of causing cancer (Webster, 2018). In order to achieve a win-win situation wherein the benefit of this industry is fully exploited while mitigating the risk, a well-structured regulatory framework needs to be in place to prevent excessive consumption or the abuse of cannabis product amongst Canadian youths and adults.References
Allen, F., & Gale, D. (1999). Bubbles, crises, and policy. Oxford Review of Economic Policy, 15(3), 9-18.
Allene, M. B., Vincent, S. J., Alsop, G. I., Ismail-zadeh, A., & Flecker, R. (2003). Late Cenozoic deformation in the South Caspian region: Effects of a rigid basement block within a collision zone. Tectonophysics, 366(3-4), 223-239. Available at: https://doi.org/10.1016/s0040-1951(03)00098-2.
Allenp, A. P., & Gillooly, J. F. (2006). Assessing latitudinal gradients in speciation rates and biodiversity at the global scale. Ecology Letters, 9(8), 947-954. Available at: https://doi.org/10.1111/j.1461-0248.2006.00946.x.
Becker, J. V., & Murphy, W. D. (1998). What we know and do not know about assessing and treating sex offenders. Psychology, Public Policy, and Law, 4(1-2), 116-137. Available at: http://dx.doi.org/10.1037/1076-8971.4.1-2.116 .
Brock, W. A., & Hommes, C. H. (1997). A rational route to randomness. Econometrica: Journal of the Econometric Society, 65(5), 1059-1095.
Brocke, W., Lakonishok, J., & LeBaron, B. (1992). Simple technical trading rules and the stochastic properties of stock returns. The Journal of Finance, 47(5), 1731-1764.
Conlisk, J. (1996). Bounded rationality and market fluctuations. Journal of Economic Behavior & Organization, 29(2), 233-250.
De Long, J. B., Shleifer, A., Summers, L. H., & Waldmann, R. J. (1990). Positive feedback investment strategies and destabilizing rational speculation. The Journal of Finance, 45(2), 379-395.
Detemple, J., & Murthy, S. (1994). Intertemporal asset pricing with heterogeneous beliefs. Journal of Economic Theory, 62(2), 294-320.
Donegan, N. H., Rodin, J., O'Brien, C. P., & Solomon, R. L. (1983). A learning-theory approach to commonalities. Commonalities in substance abuse and habitual behavior (pp. 111-156): Lexington Books.
Dumas, B., Kurshev, A., & Uppal, R. (2009). Equilibrium portfolio strategies in the presence of sentiment risk and excess volatility. The Journal of Finance, 64(2), 579-629.
Globe, & Mail. (2019). Report on business cannabis professional. Retrieved from https://www.theglobeandmail.com/robcannabispro/ . [Accessed, 19 April 2019].
Greenline POS. (2019). Case study: Earth's own naturals (BC) - greenline POS. Retrieved from https://getgreenline.co/case-study-earths-own-bc/. [Accessed 19 April 2019].
Harris, M., & Raviv, A. (1993). Differences of opinion make a horse race. The Review of Financial Studies, 6(3), 473-506.
Hecke, T. V. (2010). Power study of anova versus Kruskal-Wallis test. Research Gate. Retrieved from https//www.researchgate.net/publication/228457648 .
Janesick, V. J. (2011). Stretching exercise for qualitative researchers (3rd ed.). Thousand Oaks, CA: Sage.
Lam, T., & Xiao, H. (2000). Challenges and constraints of hospitality and tourism education in China. International Journal of Contemporary Hospitality Management, 12(5), 291-295. Available at: https://doi.org/10.1108/09596110010339643.
LeBaron, R. G., Bezverkov, K. I., Zimber, M. P., Pavelec, R., Skonier, J., & Purchio, A. (1995). βIG-H3, a novel secretory protein inducible by transforming growth factor-β, is present in normal skin and promotes the adhesion and spreading of dermal fibroblasts in vitro. Journal of Investigative Dermatology, 104(5), 844-849. Available at: https://doi.org/10.1111/1523-1747.ep12607024.
Lintner, J. (1969). The aggregation of investor's diverse judgments and preferences in purely competitive security markets. Journal of Financial and Quantitative Analysis, 4(4), 347-400.
Medicalmarijuana.ca. (2019). Marijuana laws| medical marijuana resource Canada | Medical Marijuana. Retrieved from: https://medicalmarijuana.ca/patients/marijuana-laws/. [Accessed 19 April 2019].
Miller, E. M. (1977). Risk, uncertainty, and divergence of opinion. The Journal of Finance, 32(4), 1151-1168.
Morris, S. (1996). Speculative investor behavior and learning. The Quarterly Journal of Economics, 111(4), 1111-1133.
Robinson, T. E., & Berridge, K. C. (1993). The neural basis of drug craving: An incentive-sensitization theory of addiction. Brain Research Reviews, 18(3), 247-291.
Scheinkman, J. A., & Xiong, W. (2003). Overconfidence and speculative bubbles. Journal of Political Economy, 111(6), 1183-1220.
Sedgwick, P. (2014). Non-parametric statistical tests for two independent groups: Numerical data. BMJ, 348, g2907. Available at: https://doi.org/10.1136/bmj.g2907.
Sethi, R. (1996). Evolutionary stability and social norms. Journal of Economic Behavior & Organization, 29(1), 113-140. Available at: 10.1016/0167-2681(95)00053-4.
Sharpe, N. R., Velleman, P. F., & Wright, D. J. (2018). Business statistics. Toronto: Pearson Canada.
Simon, H. (1956). Dynamic programming under uncertainty with a quadratic criterion function. Econometrica, 24(1), 74-81. Available at: 10.2307/1905261.
Teddlie, C., & Tashakkori, A. (2009). Foundations of mixed methods research: Integrating quantitative and qualitative approaches in the social and behavioral sciences: Sage.
Wang, Y., Mo, W., Yao, H., Wu, Q., Chen, J., & Chen, G. (2004). Biodegradation studies of poly(3-hydroxybutyrate-co-3-hydroxyhexanoate). Polymer Degradation and Stability, 85(2), 815-821. Available at: 10.1016/j.polymdegradstab.2004.02.010.
Webster, P. (2018). Debate over recreational cannabis use legalisation in Canada. The Lancet, 391(10122), 725-726. Available at: 10.1016/s0140-6736(18)30430-6.
Xiong, Y., Zhou, H., & Varshney, S. (2010). The economic profitability of pre-IPO earnings management and IPO underperformance. Journal of Economics and Finance, 34(3), 229-256.
Appendix
Dutchman |
N |
Mean Rank |
|
| GDNP | 1 |
2 |
47.5 |
2 |
28 |
55.54 |
|
3 |
59 |
58.65 |
|
4 |
14 |
85.43 |
|
5 |
43 |
161.77 |
|
6 |
32 |
127.19 |
|
7 |
17 |
120.29 |
|
8 |
6 |
153.92 |
|
Total |
201 |
||
| GGM | 1 |
2 |
191 |
2 |
28 |
46.21 |
|
3 |
59 |
69.05 |
|
4 |
14 |
104.21 |
|
5 |
43 |
122.74 |
|
6 |
32 |
144.77 |
|
7 |
17 |
150.24 |
|
8 |
6 |
104.58 |
|
Total |
201 |
||
| TETH | 1 |
2 |
182 |
2 |
28 |
60.57 |
|
3 |
59 |
77.5 |
|
4 |
14 |
113.93 |
|
5 |
43 |
115.91 |
|
6 |
32 |
126.58 |
|
7 |
17 |
143.32 |
|
8 |
6 |
100.42 |
|
Total |
201 |
||
| PWM | 1 |
2 |
195.75 |
2 |
28 |
43.09 |
|
3 |
59 |
68.5 |
|
4 |
14 |
115.39 |
|
5 |
43 |
129.09 |
|
6 |
32 |
138.08 |
|
7 |
17 |
140.21 |
|
8 |
6 |
115.5 |
|
Total |
201 |
||
| Canopy | 1 |
2 |
37 |
2 |
28 |
151.13 |
|
3 |
59 |
128.53 |
|
4 |
14 |
112.07 |
|
5 |
43 |
102.48 |
|
6 |
32 |
44.63 |
|
7 |
17 |
40.71 |
|
8 |
6 |
52.83 |
|
Total |
201 |