Impact of Infrastructure and Institutional Quality on Economic Growth in ECOWAS Countries
Akeju Kemi Funlayo1*
OLUSANJO Oluwaseun Jeremiah2
AKODE Thomas3
1,2,3Department of Economics Faculty of the Social Science, Ekiti State University, Nigeria. |
AbstractDeveloping countries are often faced with poor infrastructure and inadequate social welfare. It is debatable how much of these are needed for growth and what role institutional quality plays. Previous studies over decades have identified the significance of infrastructure in the growth and development of countries and regions, with most research focussing on the effect of aggregate infrastructure on economic growth. The literature on infrastructure’s role in economic growth is extended by the inclusion of access to electricity, the internet, and water supply and their effect on economic growth using recent data from 2006 to 2020 on ECOWAS countries. A structural model of growth is built with consideration of the role of institutional quality at the regional level. A one-step difference Generalized Method of Moments (GMM) estimation technique is employed to control the issue of endogeneity resulting in a negative relationship between physical infrastructure and growth. The pooled panel result reveals that interaction between infrastructural and institutional quality negatively impacts economic growth, while variant estimates of government effectiveness as an institutional quality have a positive impact on growth. |
Licensed: |
|
Keywords: |
|
Received: 8 February 2022 |
|
| (* Corresponding Author) |
Funding: This study received no specific financial support. |
Competing Interests:The authors declare that they have no competing interests. |
1. Introduction
Historical concern about the role of infrastructure in economic growth has been renewed with the transmission and liberalization of infrastructure supply from public sector monopoly power to private ownership (Calderón & Servén, 2004). Ending poverty and increasing economic growth in Africa requires industrialization improvements for employment creation for the large youth population (African Development Bank, 2019) that relies heavily on infrastructure. The supply of infrastructure has remained poor in developing countries and particularly in Africa, despite the critical role it plays in industrial productivity. Prolonging Africa’s unmet infrastructure demands means businesses in the region will continue to be restrained with productivity dampened (Calderón & Servén, 2008).
The contribution of infrastructure to economic growth has been established by earlier literature (Baita, 2020; Ekeocha, Ogbuabor, & Orji, 2021; Levoli, Belliggiano, Marandola, Milone, & Ventura, 2019; and Nugraha, Prayitno, Situmorang, & Nasution, 2020) with additional literature on the symmetric effect of physical infrastructure on poverty and inequality (Calderón & Servén, 2008). Existing literature on the relationship between infrastructure and economic growth remains inconclusive. Elburz, Nijkamp, and Pels (2017) and Timilsina, Hochman, and Song (2020) conclude there is no relationship between infrastructure investment and economic output using data on industrialized economies, particularly in North America, and Timilsina et al. (2020) reviewed a large body of literature and concluded no consensus exists on the impact of infrastructure investment on economic growth. However, others found causality (Chakamera & Alagidede, 2018; Kodongo & Ojah, 2016; and Timilsina, Stern, & Das, 2021) with differences in results associated with the use of variant methodological differences, infrastructure measurement, and variations in regional characteristics and density (Elburz et al., 2017; Timilsina et al., 2020). Some existing studies show a strong positive relationship between infrastructure development and economic growth (Akims & Danyil, 2018; Khan, Khan, Jiang, & Khan, 2020; Kurniasih, 2020; and Samir & Mefteh, 2020), whereas others find a mildly positive relationship, claiming it is not a sufficient condition for development (Luiz, 2010).
Earlier empirical works use an aggregate infrastructure that pulls the use of electricity, transport, ICT, and water together as a single component variable, except for the panel study on Africa by Ekeocha et al. (2021). Across Africa, concentration is largely on the whole continent without much attention at the sub-regional level. Some studies focus their analysis on Sub-Saharan Africa (Chakamera & Alagidede, 2018; Estache, Speciale, & Veredas, 2005; Kodongo & Ojah, 2016; and Nketiah-Amponsah, 2009). Several studies have been conducted at the country level; Lewis (1998) for Ghana, Mostert and Van Heerden (2015) for South Africa, Lall (1999); Dash and Sahoo (2010); Sahoo and Dash (2009); Srinivasu and Rao (2013) and Roy, Sarkar, Mandal, and Pandey (2014) for India, and Démurger (2001); Sahoo and Dash (2012) and Shi, Guo, and Sun (2017) for China. A few studies have been conducted for countries in South America, such as German-Soto, Héctor, and Barajas (2014) for Mexico and Urrunaga and Aparicio (2012) for Peru, with regional disparities in the country’s economic development explained by the level of infrastructure investment.
The motivation for this study comes from the need to drive industrialization among ECOWAS countries with a focus on the role of infrastructure on economic growth, with institutional quality acting as a control variable. For comprehensive results that can enhance adequate economic planning on each specific infrastructure, this study uses a dynamic panel data model to evaluate the contributions of disaggregated infrastructure quality to growth in relation to the operation of economies institutional quality in a panel of thirteen countries from 2006 to 2020. Earlier work found the role of institutional quality essential for growth and development. Capital income has been found to be associated with a country’s institutional quality (Hall & Jones, 1997; Hall & Jones, 1999). It uses the pooled mean group estimator (Pesaran, Shin, & Smith, 1999) to estimate the effects of these and other inputs on growth.
This study contributes to knowledge by using recent data up to the year 2020 on disaggregated forms of infrastructure quality, including mobile phone and internet broadband, with estimated results presented using one-step GMM regression. Although a strong positive relationship between infrastructure and economic growth has been reported in less developed countries that are deprived of adequate infrastructure (Calderón & Servén, 2010; Chakamera & Alagidede, 2018; Kodongo & Ojah, 2016), whether this finding holds for ECOWAS regional economies remains in debate.
The paper is organized as follows: Section 2 presents a review of previous research on the relationship between infrastructure and economic growth. The data and methodology are presented in Section 3, Section 4 discusses the results and findings, while Section 5 presents and interprets the results. Section 6 draws key conclusions and policy insights.
2. ECOWAS Economic Growth, Infrastructure, and Institutional Quality
2.1. Africa’s Regional Growth and ECOWAS Countries’ Performance
Economic growth and performance vary across the African region. Table 1 presents the estimates of real GDP growth (percent) across Africa, where East Africa recorded the highest growth rate of 5.5 percent in 2019, while South Africa stood at 0.3 percent, alluding to a decline in structural transformation and increasing unemployment. However, North, Central, and West Africa had GDP growth rates of 4.0, 2.9, and 3.6 percent, respectively. Furthermore, in 2020, estimated GDP growth was negative except for the East African region, which stood at 0.7 percent. This is because countries in East Africa responded swiftly to the Covid-19 pandemic, including enforcing lockdown protocols and devising alternative survival measures while in lockdown. Nevertheless, South Africa had the highest negative growth rate of 7 percent as it was hit hard by the Covid-19 outbreak since South Africa is the largest contributor in the region. Other African regions were reluctant to implement proactive measures to curb and manage Covid-19 when the pandemic first started. The projected economic growth for 2021 and 2022 for North Africa was 4 and 6 percent, respectively, representing the highest in both years, while West Africa was estimated to have the lowest growth rate in 2021, and South Africa was predicted to be the lowest in 2022.
| December 2020 estimates | ||||
| Region | 2019 |
2020 estimated |
2021 projected |
2022 projected |
| North Africa | 4.0 |
–1.1 |
4.0 |
6.0 |
| East Africa | 5.3 |
0.7 |
3.0 |
5.6 |
| Central Africa | 2.9 |
–2.7 |
3.2 |
4.0 |
| West Africa | 3.6 |
–1.5 |
2.8 |
3.9 |
| South Africa | 0.3 |
–7.0 |
3.2 |
2.4 |
| Source: African Economic Outlook (2020). |
Figure 1 presents the estimates of gross domestic growth rates across ECOWAS countries in 2019 and 2020. It is important to note that economic growth rates for West Africa are low and inconsistent between 2019 and 2020. This is a result of over-dependence in the sales of natural resources such as crude oil, corruption, inadequate infrastructure, and incessant conflict as in Nigeria. Fallout from Covid-19 led to a drop in GDP growth rates across many countries with only a few recovering rapidly.
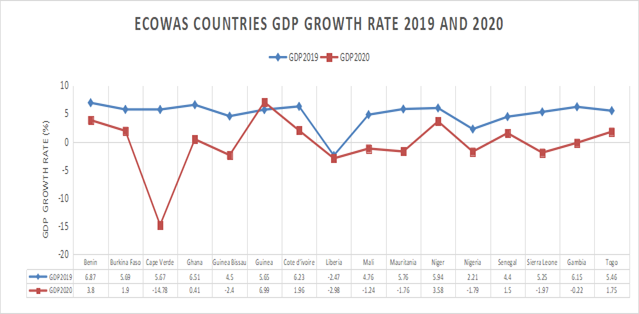
Figure 1. ECOWAS countries GDP growth rate (World Development Indicators (WDI), 2020).
2.2. Infrastructure Quality in ECOWAS
While some developing African countries have far better infrastructure than others, overall, ECOWAS countries remain below the world average for both quantity and quality. Figure 2 presents the graph of the overall infrastructure performance in 2017-2018 for ECOWAS member countries with all countries below the value of 5 in the rank 1-10.
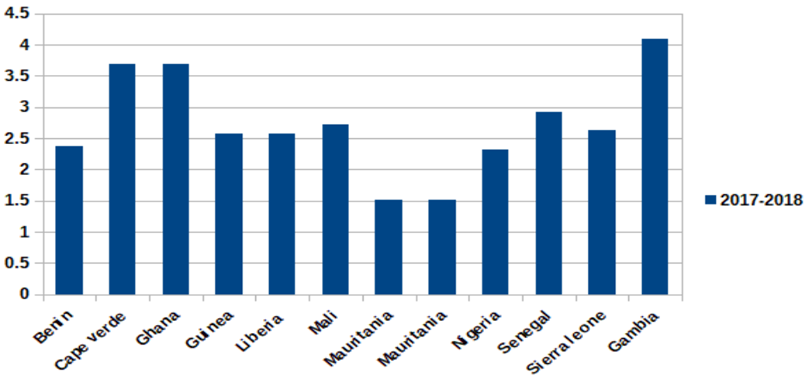
Figure 2. Graph of overall infrastructure in ECOWAS countries (Global Competitive Index).
2.3. Assessment of Institutional Quality in ECOWAS
The institution can be broadly classified into three yardsticks, namely economic institutions, political institutions, and political power. Economic institutions influence the nature and workings of economic agents while they make decisions that influence or affect investment, consumption, and the use of resources. Political institutions are actors who influence the election of officeholders in the political sphere. However, political power relates to how economic and political institutions are effectively allocated without any form of nepotism attached (Acemoglu, Robinson, & Johnson, 2005). According to the Worldwide Governance Indicators (WGI) (2021), institutional quality can be determined with respect to six (6) yardsticks, including voice and accountability, political stability and absence of violence or terrorism, government effectiveness, regulatory quality, rule of law, and control of corruption. However, data from the WGI reveals that most ECOWAS countries are characterized by the existence of low institutional quality which can be clearly seen in the rise in terrorism and social vice, corruption, nepotism, misuse of public trust, and a host of other elements. Institutions have been with us since ancient times and there are historical antecedents as to how some communities, societies, and nations have thrived which have led to massive and sustainable growth and development, and how others have failed leading to a perpetual decline in productivity and quality of livelihood. Several factors influence institutional quality including education, exposure, and values, the legal system, geographical location, colonial history, international openness, natural resource endowment, and economic and financial power. This study considers three indicators of institutional quality, namely political stability, government effectiveness, and control of corruption, for ECOWAS countries
3. Data and Methodology
3.1. Data
This study uses data from 2006 to 2020 on sixteen ECOWAS countries, namely lower-income countries Burkina Faso, The Gambia, Guinea, Guinea Bissau, Liberia, Mali, Niger Republic, Sierra Leone, and Togo, and lower-middle income countries Benin Republic, Cape Verde, Ghana, Cote d’Ivoire, Mauritania, Nigeria, and Senegal. The dependent variable ‘economic growth’ is represented by the annual growth rate of the GDP, while explanatory variables of infrastructure quality are access to electricity, internet users, and drinking water services. All infrastructure data comprising the GDP growth rate and other control explanatory variables of capital, measured as gross capital formation in the percentage of GDP, and urbanization levels, measured as the urban population over the total population, were taken from the World Development Indicators (WDI) (2020) World Development Index 2020. Datasets on the institutional quality index comprising political stability, government effectiveness, and control of corruption were extracted from the Worldwide Governance Indicators (WGI) (2021).
3.2. Theoretical Framework and Model Specification
A basic production function is set up as a function of infrastructure (P) and a set of standard growth determinants (Z):
Where:
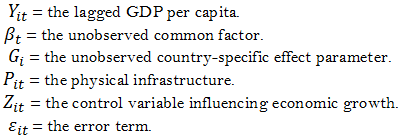
is the country’s i output at time t which is GDP per capita, Pit is a measure of variables of physical infrastructure, and Zit is the institutional quality and other control variables.
On a panel data form, the growth equation is of the form:
Where:
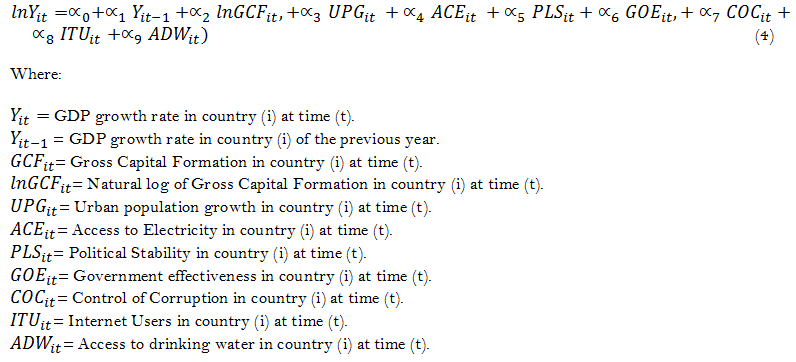
This study focuses on the interaction of infrastructure and institutional quality on economic growth. The model specification can be expressed from equation (2) as:
The baseline specification of the system GMM becomes:
3.3. Estimation Techniques
The descriptive analysis of all variables is achieved using descriptive statistics of mean, minimum, and maximum values, standard deviation, skewness, and kurtosis. The test for stationarity is conducted with the IM Pesaran and Shin panel unit root technique and the model estimation is conducted using a one-step system GMM which is an improved technique over static regression deficiencies. The system GMM solves the problem of endogeneity, enhances consistency, and takes care of heterogeneity associated with the estimation model. The lagged dependent variable, Yit, is endogenous because of the presence of the country-specific effect. A further test for instrumental validity and the overall robustness of the result is established with the Sargan and Hansen tests (or J-test). The consistency of the methodology is enhanced in this study by adjusting the model’s instruments to accommodate features that are peculiar to ECOWAS while the inclusion of institutional quality accounts for how a country’s governance and strength affect the quality of both economic and physical infrastructures which has implications for the economic growth of the region.
| Measure | Y |
ITU |
ADW |
ACE |
PLS |
GOE |
COC |
UPG |
GCF (mill) |
| Mean | 4.744 |
13.308 |
66.358 |
39.313 |
-0.578 |
-0.764 |
-0.583 |
3.763 |
3.181 |
| Maximum | 20.715 |
61.943 |
88.769 |
95.533 |
0.963 |
0.353 |
0.950 |
5.685 |
4.061 |
| Minimum | -20.598 |
0.227 |
41.190 |
1.300 |
-2.400 |
-1.760 |
-1.558 |
1.782 |
2.180 |
| Std. dev. | 3.726 |
14.284 |
11.375 |
22.662 |
0.791 |
0.440 |
0.522 |
0.731 |
6.241 |
| Skewness | -0.968 |
1.392 |
-0.197 |
0.415 |
-0.344 |
0.493 |
1.144 |
-0.011 |
3.442 |
| Kurtosis | 14.128 |
4.191 |
2.313 |
2.271 |
2.440 |
2.741 |
4.616 |
3.562 |
16.534 |
| Observations | 225 |
225 |
225 |
225 |
225 |
225 |
225 |
225 |
225 |
4. Result and Discussion
4.1. Descriptive Statistics
Table 2 shows the descriptive analysis of both endogenous and exogenous variables in the study. The result shows that among the variables, gross capital formation (GCF) has the highest mean, maximum, minimum, and standard deviation values in millions whereas among the physical infrastructure, access to water (ADW) has the highest mean value of 66, internet use has a mean of 13, while access to electricity (ACE) applies to 39% of the population. A huge gap is found in the maximum and minimum values of these physical infrastructures with access to electricity recording the lowest minimum value of 1.30. These statistics reflect the poor supply of infrastructure in ECOWAS and the low performance index of the overall infrastructure.
All measurements of the institutional quality index recorded negative index values, with political stability (PLS) having the lowest mean value of -0.57, control of corruption (COC) is -0.58, while government effectiveness (GOE) is -0.76 with the lowest maximum values and standard deviation of 0.35 and 0.44, respectively.
Furthermore, GDP growth rate (Y), urban population growth (UPG), political stability (PLS), internet users (ITU), government effectiveness (GOE), control of corruption (COC), access to drinking water (ADW), and access to electricity (ACE) are all long-left tail (i.e., negative skewness) while gross capital formation (GCF) is a long-right tail distribution (i.e., positive skewness). Nevertheless, internet users (ITU), urban population growth (UPG), gross capital formation (GCF), and control of corruption (COC) are greater than three, which implies they are mesokurtic, whereas political stability (PLS), government effectiveness (GOE), and access to drinking water (ADW) are platykurtic because their corresponding values are less than three.
| Variable | Level |
First difference |
| Y | -3.74764** |
-7.93924 |
| LNGCF | -0.54432 |
-5.74839** |
| GOE | 0.00235 |
-3.64278** |
| ITU | 3.12892 |
-2.17260** |
| PLS | -0.75262 |
-5.13994** |
| UPG | -1.38338 |
-7.56378** |
| ADW | -3.55183** |
5.47256 |
| ACE | 1.87596 |
-6.85908** |
| COC | 0.37279 |
-4.37224** |
Note: The null hypothesis indicates the presence of unit root with ** significant at 5%. |
Table 3 shows the Pesaran and Shin test for unit root indicating the GDP growth rate (Y) and access to drinking water (ADW) is stationary while gross capital formation (LNGCF), government effectiveness (GOE), internet users (ITU), political stability (PLS), urban population growth (UPG), access to electricity (ACE), and control of corruption (COC) are stationary at first difference. Also, all the variables are used without their log form except gross capital formation (GCF).
| Variable | Coefficient |
Std. Error |
t-Statistic |
Prob. |
| Y(-1) | 0.133 |
0.061 |
2.186 |
0.046 ** |
| UPG | 0.214 |
1.181 |
0.181 |
0.858 |
| PLS | 0.522 |
1.803 |
0.289 |
0.776 |
| ITU | -0.005 |
0.054 |
-0.103 |
0.919 |
| GOE | 1.496 |
3.329 |
0.449 |
0.660 |
| COC | -1.929 |
2.449 |
-0.787 |
0.444 |
| ADW | -0.075 |
0.131 |
-0.574 |
0.575 |
| ACE | -0.103 |
0.102 |
-1.012 |
0.328 |
| LNGCF | 1.947 |
1.766 |
1.102 |
0.288 |
Note: J-statistic 108.38, AR (2) 0.138, Prob (J-statistic) 0.090. |
| Variable | Coefficient |
Std. Error |
t-Statistic |
Prob. |
| Y(-1) | 0.219 |
0.066 |
3.310 |
0.001 *** |
| UPG | -0.004 |
0.446 |
-0.010 |
0.991 |
| PLS | -0.107 |
0.502 |
-0.213 |
0.830 |
| ITU | -0.001 |
0.027 |
-0.061 |
0.950 |
| GOE | 2.163 |
1.432 |
1.510 |
0.132 |
| COC | -0.454 |
1.095 |
-0.415 |
0.678 |
| ADW | 0.015 |
0.047 |
0.318 |
0.750 |
| ACE | -0.027 |
0.028 |
-0.963 |
0.336 |
| LNGCF | 0.159 |
0.115 |
1.380 |
0.168 |
| C | 0.867 |
4.944 |
0.175 |
0.860 |
Note: Adjusted R-squared 0.056, F-statistic 2.382, Durbin-Watson stat 1.903, Prob (F-statistic) 0.0139. |
4.2. One-step System GMM
The one-step difference GMM results presented in Table 4a show the coefficient value of the lagged dependent variable (Y-1) is statistically significant at 5 percent (0.046 **), so by implying a unit increase in the economic growth of the previous year (Y-1) it leads to a 0.133 increase in the economic growth (Y) in the short-term. Furthermore, urban population growth (UPG) positively relates to economic growth in the short term at a significance level of ten percent.
The physical infrastructure comprising internet users (ITU), access to drinking water (ADW), and access to electricity (ACE) have negative relationships with economic growth while political stability (PLS), government effectiveness (GOE), and gross capital formation (LNGCF) are positively related to economic growth but statistically insignificant in the short-term, with control on corruption (COC) exhibiting a negative relationship. The implication is that poor infrastructure in ECOWAS countries impedes economic growth and the very low control of corruption in the region also hampers expansion. Institutional quality is to serve as the mechanism of aid to economic growth and development and slower, low-quality growth across sectors in ECOWAS. The pooled panel means regression in Table 4b also exhibited a similar result, with Y-1 being statistically significant at 1 percent (0.001 ***) with implications that a unit increase in economic growth from the previous year (Y-1) will lead to a 0.219 increase in economic growth (Y) in the short-term. Physical infrastructure, internet users (ITU), and access to electricity (ACE) respond negatively to economic growth and institutional quality measured by the control on corruption (COC) and political stability (PLS) also exhibits a negative relationship.
From the one step GMM results, AR (2) value of 0.1380 indicates the model is free from autocorrelation while the probability value of the J-Statistic of 0.090876 (Hansen & Segan Test) shows that the model specification is appropriate.
5. Conclusion
From the results obtained in the GMM regression, we can conclude that the infrastructure growth link is weak in ECOWAS due to the poor quality of infrastructure. Countries in West Africa have a low supply of infrastructures such as internet services or coverage, access to potable water, availability of basic sanitary facilities at home, and access to electricity which are majorly attributed to their low institutional quality. This issue of downward trends in institutional quality is a continual challenge, thus, good governance, transparency, stability, and effectiveness should be taken into great consideration. Also, mechanisms for checks and balances are required in all government establishments to help curb and reduce the issue of corruption, political stability, and the rule of law in these countries.
Nevertheless, commitment towards improving the quality and quantity of social amenities and services should be seriously considered as this will not only lead to the improvement of the quality of living but will also lead to the creation of jobs, which invariably leads to a reduction in the unemployment rate.
References
Acemoglu, D., Robinson, J. A., & Johnson, S. (2005). Institutions as a fundamental cause of long-run growth. Handbook of Economic Growth, 1, 385-472.Available at: https://doi.org/10.1016/s1574-0684(05)01006-3.
African Development Bank. (2019). African economic outlook 2019: Africa's macroeconomic performance and prospects. Abidjan: African Development Bank.
Akims, K. A., & Danyil, C. J. (2018). Infrastructural development as a strategy for Nigeria’s export promotion. African Research Review, 12(4), 40-49.Available at: https://doi.org/10.4314/afrrev.v12i4.4.
Baita, K. (2020). Impact of infrastructure on trade: An empirical assessment by the gravity model in ECOWAS.Available at: http://dx.doi.org/https://doi.org/10.2139/ssrn.3536898.
Calderón, C., & Servén, L. (2004). The effects of infrastructure development on growth and income distribution. Working Paper No. 270, Central Bank of Chile, Santiago.
Calderón, C., & Servén, L. (2008). Infrastructure and economic development in Sub-Saharan Africa. Policy Research Working Paper 4712.The World Bank Development Research Group Macroeconomics and Growth Team September 2008.
Calderón, C., & Servén, L. (2010). Infrastructure and economic development in Sub-Saharan Africa. Journal of African Economies, 19(1), 13-87.
Chakamera, C., & Alagidede, P. (2018). The nexus between infrastructure (quantity and quality) and economic growth in Sub-Saharan Africa. International Review of Applied Economics, 32(5), 641-672.Available at: https://doi.org/10.1080/02692171.2017.1355356.
Dash, R. K., & Sahoo, P. (2010). Economic growth in India: The role of physical and social infrastructure. Journal of Economic Policy Reform, 13(4), 373-385.Available at: https://doi.org/10.1080/17487870.2010.523980.
Démurger, S. (2001). Infrastructure development and economic growth: An explanation for regional disparities in China? Journal of Comparative Economics, 29(1), 95-117.Available at: https://doi.org/10.1006/jcec.2000.1693.
Ekeocha, D., Ogbuabor, J., & Orji, A. (2021). Public infrastructural development and economic performance in Africa: a new evidence from panel data analysis. Economic Change and Restructuring, 1-20.Available at: https://doi.org/10.1007/s10644-021-09334-8.
Elburz, Z., Nijkamp, P., & Pels, E. (2017). Public infrastructure and regional growth: Lessons from meta-analysis. Journal of Transport Geography, 58(C), 1-8.Available at: https://doi.org/10.1016/j.jtrangeo.2016.10.013.
Estache, A., Speciale, B., & Veredas, D. (2005). How much does infrastructure matter to growth in Sub-Saharan Africa. Unpublished, World Bank (June 2005).
German-Soto, V., Héctor, A., & Barajas, B. (2014). The nexus between infrastructure investment and economic growth in the Mexican Urban Areas. Modern Economy, 5(13), 1208–1220.
Hall, R. E., & Jones, C. I. (1997). Levels of economic activity across countries. The American Economic Review, 87(2), 173-177.
Hall, R. E., & Jones, C. I. (1999). Why do some countries produce so much more output per worker than others?". Quarterly Journal of Economics, 114(1), 83-116.Available at: https://doi.org/10.3386/w6564.
Khan, H., Khan, U., Jiang, L. J., & Khan, M. A. (2020). Impact of infrastructure on economic growth in South Asia: Evidence from pooled mean group estimation. The Electricity Journal, 33(5), 106735.Available at: https://doi.org/10.1016/j.tej.2020.106735.
Kodongo, O., & Ojah, K. (2016). Does infrastructure really explain economic growth in Sub-Saharan Africa? Review of Development Finance, 6(2), 105-125.Available at: https://doi.org/10.1016/j.rdf.2016.12.001.
Kurniasih, D. E. (2020). Infrastructure and Inclusive economic growth in decentralized Indonesia. Jurnal Ilmiah Administrasi Publik, 6(1), 16-24.Available at: https://doi.org/10.21776/ub.jiap.2020.006.01.3.
Lall, C. M. (1999). India spruces up its IP regime and its enforcement. The Journal of World Intellectual Property, 2(6), 961-968.Available at: https://doi.org/10.1111/j.1747-1796.1999.tb00101.x.
Levoli, C., Belliggiano, A., Marandola, D., Milone, P., & Ventura, F. (2019). Information and communication infrastructures and new business models in rural areas: The case of molise region in Italy. European Countryside, 11(4), 475-496.Available at: https://doi.org/10.2478/euco-2019-0027.
Lewis, B. D. (1998). The impact of public infrastructure on municipal economic development: Empirical results from Kenya. Review of Urban & Regional Development Studies, 10(2), 142-156.Available at: https://doi.org/10.1111/j.1467-940x.1998.tb00092.x.
Luiz, J. (2010). Infrastructure investment and its performance in Africa over the course of the twentieth century. International Journal of Soc. Econ, 37(7), 512–536.Available at: https://doi.org/10.1108/03068291011055450.
Mostert, J., & Van Heerden, J. (2015). A computable general equilibrium (CGE) analysis of the expenditure on infrastructure in the limpopo economy in South Africa. International Advances in Economic Research, 21(2), 227-236.Available at: https://doi.org/10.1007/s11294-015-9524-1.
Nketiah-Amponsah, E. (2009). Public spending and economic growth: Evidence from Ghana (1970–2004). Development Southern Africa, 26(3), 477-497.Available at: https://doi.org/10.1080/03768350903086846.
Nugraha, A. T., Prayitno, G., Situmorang, M. E., & Nasution, A. (2020). The role of infrastructure in economic growth and income inequality in Indonesia. Econ Sociolo, 13(1), 102–115.Available at: https://doi.org/10.14254/2071-789x.2020/13-1/7.
Pesaran, M. H., Shin, Y., & Smith, R. P. (1999). Pooled mean group estimation of dynamic heterogeneous panels. Journal of the American statistical Association, 94(446), 621-634.Available at: https://doi.org/10.1080/01621459.1999.10474156.
Roy, B. C., Sarkar, S., Mandal, N. R., & Pandey, S. (2014). Impact of infrastructure availability on level of industrial development in Jharkhand, India: A district level analysis. International Journal of Technological Learning, Innovation and Development, 7(2), 93-123.Available at: https://doi.org/10.1504/ijtlid.2014.065880.
Sahoo, P., & Dash, R. K. (2009). Infrastructure development and economic growth in India. Journal of the Asia Pacific economy, 14(4), 351-365.Available at: https://doi.org/10.1177/097493061100200204.
Sahoo, P., & Dash, R. K. (2012). Economic growth in South Asia: Role of infrastructure. The Journal of International Trade & Economic Development, 21(2), 217-252.Available at: https://doi.org/10.1080/09638191003596994.
Samir, S., & Mefteh, H. (2020). Empirical analysis of the dynamic relationships between transport, ICT and FDI in 63 countries. International Economic Journal, 34(3), 448-471.Available at: https://doi.org/10.1080/10168737.2020.1765186.
Shi, Y., Guo, S., & Sun, P. (2017). The role of infrastructure in China’s regional economic growth. Journal of Asian Economics, 49(C), 26-41.Available at: https://doi.org/10.1016/j.asieco.2017.02.004.
Srinivasu, B., & Rao, P. S. (2013). Infrastructure development and economic growth: Prospects and perspective. Journal of Business Management and Social Sciences Research, 2(1), 81-91.
Timilsina, G., Stern, D. I., & Das, D. (2021). How much does physical infrastructure contribute to economic growth? World Bank Policy Research Working Paper, (9888).
Timilsina, G. R., Hochman, G., & Song, Z. (2020). Infrastructure, economic growth, and poverty: A review. World Bank Policy Research Working Paper No. 9258.
Urrunaga, R., & Aparicio, C. (2012). Infrastructure and economic growth in peru. Cepal Review, 107, 145–163.Available at: https://doi.org/10.18356/8537fd57-en.
World Development Indicators (WDI). (2020). Databank. Retrieved from: https://databank.worldbank.org/source/world-development-indicators.
Worldwide Governance Indicators (WGI). (2021). Databank. Retrieved from: https://databank.worldbank.org/source/worldwide-governance-indicators.