The Influence of Service Quality and Corporate Image on Student Loyalty: A Case Study in A School of Business and Management in Jakarta
Sukirno1
Baby Poernomo2*
2STIAMI – Institute of Social Sciences and Management Jakarta-Indonesia |
AbstractThis study was conducted to determine the Service Quality, Corporate Image and Student Loyalty in postgraduate of a Business School and Management as well as the influence of Service Quality and Corporate Image simultaneously and partially on Student Loyalty in a Business School and Management. This study uses the quantitative method approach to see how big the effect of independent variables to the dependent variable. Sampling studies as many as 54 respondents using Sanvord Labovitz formula of the study population as many as 535 students of regular classes. Each respondent was given a total of 42 closed ended questions with five alternative answers using a Likert scale. The results showed that there is a positive and significant effect of Service Quality and Corporate Image partially or simultaneously to the Students Loyalty. Findings of this research help improve the quality of service of the institution not only about the infrastructure but also quality of the lecturers, the computer laboratory, the library, the service training to the existing administrative personnel, especially for employees who are in direct contact with the students, and the curriculum which should follow the development of science and the willingness of the labor market. |
Licensed: |
|
Keywords: |
|
| (* Corresponding Author) | |
Funding: This study received no specific financial support. |
Competing Interests:The authors declare that they have no competing interests. |
1. Introduction
Universities as educational institutions have a big role in the development of human resources (HR) and increase community competitiveness. Education has become a basic need of society. Colleges must have qualified human resources so that the strategic role can be implemented.
Increased competition is sharply forcing organizations or companies to focus on improving the quality of human resources that can be relied upon in the face of existing competition in order to meet the needs and desires of customers (students). Improving the quality of human resources can only be done by qualified educational institutions, both public and private universities. Universities are forums for the formation of quality human resources needed for future development through the education process.
The education process involves various elements including students, faculty, employees, parents, government, facilities and infrastructure and other parties that will determine the success of educational institutions in producing quality young generation in accordance with the demands and progress of the times. The higher level of education of a society will indirectly push the national development level more quickly and directed toward the desired development.
The role of educational institutions as a place for forging community learning to absorb all knowledge in depth becomes one of the determinants of the success of future development. Service user satisfaction (student) becomes a measure of the success of educational institutions in managing their institutions and still prioritizes academic quality as a service product that must be achieved. Accreditation of the study program is a form of accountability of Higher Education to the public, as quoted in Decree of the Minister of National Education of the Republic of Indonesia No. 32 / 2016 on the Accreditation of Studies Program at universities.
One of the factors considers the community when choosing an educational institution is whether the university can produce qualified graduates.
Therefore, private educational institutions are really required to provide quality education services in accordance with the demands and expectations of customers (students). However, until now, there are still many complaints about services that are less friendly of the staff, facilities and infrastructure are still inadequate, narrow parking space and even the availability of computers, academic information system used still cannot meet the needs of the service areas, lecturers are lack discipline in attendance in the classroom, the number of books in the library is still limited and not diverse, especially information in the internet media is still far from adequate. This is the cause of the decreased level of student loyalty.
If students’ complaints can be resolved properly, then the students will try to complete their studies on campus to the highest level on the university's study program. A strategy for an institution to compete is to provide the best service and build a good image in the eyes of students and society, because the service and image can affect the process of purchasing a product / service. The performance of service in accordance with customer expectations leads the service provider to have a competitive advantage in the eyes of consumers not only on satisfaction but also impact on customer loyalty (Lu & Seock, 2008).
Conversely, if the customers are dissatisfied with the services provided, the institutional image will look bad and affect the unfamiliarity of a university in the community because it is considered unable to bear quality graduates. This research is intended to explore:
1. How much is the influence of Corporate Image to Graduate Studies Program?
2. How much is the influence of Student Loyalty to Graduate Studies Program?
3. How much is the influence Service Quality and Corporate Image to Student Loyalty either partially or simultaneously?
2. Literature Review
2.1. Definition of Administration
(Siagians, 2008) in the Philosophy of Administration says that Administration is the whole process of cooperation between two people or more based on certain rationality to achieve predetermined goals. Leonard D. White as cited in Moynihan (2009) states that administration is a common process in all human endeavors, public or private, civil or military, large or small.
From the above definitions, it can be concluded that the administration is an arrangement of cooperation, from the activities of a group of people, to achieve certain goals, with a high level of rationality. The nature of administration based on these definitions is: Arrangement / Cooperation, Activity of a group of people to achieve certain objectives rationally.
2.2. Definition of Education Service Marketing
Kotler as cited in Lupiyoadi, Rambat, and Hamdani (2008) states that understanding services is any action or activity that a party can offer to another party, which is essentially intangible and cannot result in any ownership. Production may be attributed or not linked to a physical product. Meanwhile, the marketing mix is a set of variables of marketing that can be controlled by the company and used to achieve goals in the target market. According to Dharmesta and Handoko (2008) the marketing mix is a combination of four variables or activities that are the cores of the company's marketing system, namely product, price structure, promotion and distribution activities. Thus, the marketing mix is: the marketing variables used to achieve the goal.
2.3. Definition of Service Quality
The conventional definition of quality usually describes the direct characteristics of a product such as: performance, reliability, ease of use, aesthetics, and so on. However managers of companies that are competing in the global market must pay serious attention to the definition of quality that is strategic in nature, namely: quality is anything that is able to meet customer needs (meeting the needs of customers). Product features or excellence can be measured through the level of customer satisfaction.
This feature does not only consist of product characteristics that are offered, but also the services that accompany the product, such as: marketing methods, payment methods, delivery provisions, and others (Gaspersz, 2011).
Wyckop in Tjiptono and Chandra (2012) suggests the quality of service as a measure of how good the level of service provided is able to match customer expectations. Quality of service can be realized through the fulfillment and desires of customers to compensate for customer expectations. Parasuraman in Lupiyoadi et al. (2008) suggests that service quality is a measure of overall assessment of the level of a good service, service quality as a result of the perception of the comparison between customer expectations with the actual performance of service.
Based on the above understanding, it can be concluded that the quality of service is a level of superiority that a person perceived a service expected from the comparison between desire and perceived performance of consumers after buying the service.
Apart from that, for the company is always approached and remembered by the customer then the service must be given by developing the best service pattern which according to Atep Adya Barata cited in Badri, Yusnizal, Hushori, and Yusuf (2018) among others by the following ways:
- Paying attention to the development needs and desires of customers from time to time, for ease of anticipation.
- Seek to provide the customer's needs as needed or more than he or she hopes and
- Treat customers with the best service pattern.
Success in developing and implementing excellent service cannot be separated from the ability in the selection of the concept approach. Barata as cited in Badri et al. (2018) stated that there are two main factors affecting service quality. Firstly, the factors that affect the quality of internal services (interaction of employees), namely the organization's general management pattern, the provision of supporting facilities, human resources development, work climate and alignment of employment relationships, and incentive patterns. Secondly, factors that affect the quality of external services (external customers), namely the pattern of services and the procedures for the provision of services, the pattern of service/ distribution services, the pattern of service sales services, and service patterns in service delivery.
While Gaspersz (2011) argues that factors influencing customer perception and expectation on service, are the needs and desires associated with
things that customers feel when he is trying to make transactions with the company; Past experience when using the services of company; the experience of friends, where they will tell about service quality they are received and communication through advertising and marketing that also affects the customer's perception of the services to be received.
2.4. Service Quality Dimension
A service quality approach that is widely used as a reference in marketing research is the Service Quality (ServQual) Model. According to Parasuraman and his colleagues who developed this model in North America, the ServQual model is built on the comparison of two main factors, namely customer perceptions of the actual service they receive (perceived service) with the expected service. The designer of this model identifies five major components of service quality (Lupiyoadii, 2013) namely: 1) Reliability, namely the ability of the company to provide services in accordance with the promised accurately reliable. Performance must be in line with customer expectations that mean punctuality, equal service for all customers, without error, sympathetic attitude and with high accuracy. 2) Tangible, ie the ability of the company to show its existence to outsiders. The company's physical facilities and infrastructure that are visible and can be utilized by its surroundings are clear evidence of the existence of the service provider. This includes physical facilities such as buildings, equipment and equipment used (technology) and the performance of the employees. 3) Responsiveness, which is a policy to help and deliver a fast and precise service to the customer, and the delivery of clear information. Allowing customers to wait becomes a negative perception in service quality. 4) Assurance, which is the knowledge and ability of employees to foster the trust of customers to the company. This includes several components, including communication, credibility, security, competence and courtesy. 5) Empathy, which gives a sincere and personal attention to the customers. Companies are expected to have understanding and knowledge about customers, understand their specific desires and needs, and provide convenient service time. Thus, in the context of this study, the authors draw conclusions from the sharing of expert opinions that serve as a reference that dimensions of Service Quality namely: 1) Reliability, 2) Responsiveness, 3) Tangible, 4) Assurance (Warranty of Certainty), 5) Empathy, 6) Action.
2.5. Definition of Image
According to Kotler (2009) definition or understanding of the image as a set of beliefs, ideas, and impressions that are owned by a person against an object. Frank Jefkins, in his, Public Relation Technique, concludes that in general, the image is defined as the impression of a person or an individual about something that arises as a result of his knowledge and experience (Soemirat, 2010).
Meanwhile, Jalaludin Rachmat in his book, Communication Psychology mentioned that the image is a depiction of reality and not necessarily in accordance with reality, the image is the world according to perception. Solomon in Rakhmat suggests an attitude to someone or something depends on our image of the person or object (Soemirat, 2010).
Kotlere and Armstrong (2013) states that corporate image is a set of beliefs, ideas and impressions that are owned by a person against a company. The image is formed from how an institution conducts its operational activities, which has a primary basis in terms of service. There are several types of images according to Frank Jefkins (Soemiratt & Ardianto, 2008) namely:
1) Mirror Image
An educational institution should be able to see for themselves how the image they display in serving the public. Institutions must be able to evaluate their appearance whether it is maximized in providing services or can still be improved again.
2) Multiple Image
Sometimes members of the community have various images of the company or educational institutions for example they are already satisfied, but there are still many shortcomings and need to be improved. Some are satisfied for certain services, and are not satisfied with some other service sector.
3) Current Image
How image to companies or educational institutions in general is called current image. Current image should be known by all employees of the company, so that where there is a possibility this general image can be fixed.
4) Wish Image
It is the desired image that management wants to achieve certain achievements. This image is applied to something new before the external public gets complete information. Based on the above description, the college should try to create a positive image in the hearts of the community, so that the community can make a decision to enrol their children to the college concerned.
2.6. Dimension of the Corporate Image
The Corporate Image Index Survey measures institutional image based on four dimensions:
1) Quality. It relates to the quality of the institution's products or services, its ability to innovate and how much trust the institution will have.
2) Performance. It relates to the financial performance of the institution and its business capability to grow.
3) Responsibility. It deals with environmental concerns and social responsibility.
4) Attractiveness. It includes the image of the institution built by its qualified employees and how far it becomes the preferred place to work.
Keller (2013) put forward the corporate image dimension of four important associations, namely:
1) Common Product, Attributes, Benefits or Attitudes. The company's name or brand can attract customers to a high association of product attributes and marketing innovations by marketers.
2) People and Relationship. Corporate image can be seen from the characteristics of employees such as services provided to customers.
3) Value and Programs. Corporate image can be seen from the values and programs of institutions that do not have to be related to the product being sold, for example the form of social awareness, awareness of the surrounding environment.
4) Corporate Credibility. Corporate image may be an opinion, or statement of the institution, as well as a belief in the institution competent in selling the product and delivering its services, as well as the degree of likability and interest of the customer to the institution.
2.7. Definition of Customer Loyalty
Griffin, cited in Supriadi (2011) assesses customer loyalty as a more reliable measure to predict sales and financial growth, compared to customer satisfaction. Many institutions rely on customer satisfaction as a guarantee of success in the future but then are disappointed to find that their satisfied customers can shop for competitors' products without hesitation. According to Griffin Supriadi (2011) to maintain and grow customer loyalty, there are two critical factors:
1) A high attachment factor to a particular product is compared to a competitor's product. The attachment felt by a customer is shaped by two dimensions: the level of preference, ie how much a customer's confidence in a particular product, and by the degree of differentiated product differentiation, the customer's ability to differentiate the company's product from the competitor's product significantly demonstrates the success of product differentiation.
2) Repurchase. Loyalty will not happen if a customer does not re-buy.
Griffin cited in Supriadi (2011) states that Loyality is defined as non-random purchase expressed over time by some decision making unit. According to Griffin, the characteristics of loyal customers are as follows: 1) Re-buy regularly (makes regular repeat purchase), 2) Loyalty refers more to the behavioral form of decision-making units to make a continuous purchase of goods / services of a selected company, 3) Buying outside the product / service line (purchases across product and service lines). Customers who already believe in the company in a matter then will believe also for other affairs. 4) Referencing the store to others, which means attracting new customers to the company (Refers other) and 5) Demonstrates the immune attraction of a competitor (Demonstrates an immunity to the full of the competition).
3. Hypothesis
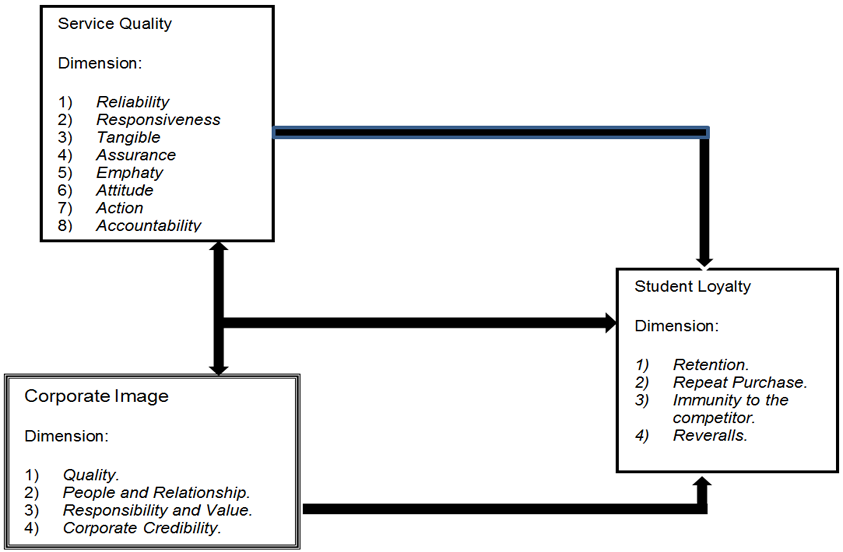
Based on previous theories and research described above, the framework of this research is as follows:
1. The effect of Service Quality on Student Loyalty
Kotler (2009) argues that customer satisfaction is the feeling of pleasure or disappointment of someone who emerged after comparing the performance / product results thought to the expected performance / results. If the performance is below expectations, then the customer is not satisfied. If the performance meets expectations, the customer is satisfied. If the performance exceeds expectations, the customer is very satisfied or happy. The customer consciously or unconsciously will always evaluate the transactions performed. If the customer is satisfied then the decision to make a purchase may occur.
2. The influence of Corporate Image to Student Loyalty
A customer will give a high value to a service if he feels the benefits gained greater than the cost incurred, as well as other services from competitor service providers are not able to provide better benefits. The more valuable a service the more customer needs that service can fulfil. Thus, reputable institutions providing high value services can apply higher prices than competitor prices. The customer's perception of the product or service influences the level of customer importance, customer satisfaction, and value. In other words, if the created corporate image can provide satisfaction to the customer, then a satisfied customer may be allowed to re-purchase.
3. Partial and simultaneous to Student Loyalty
Student loyalty will be created when students feel satisfied with the services provided. Students will fully put their trust in the guarantee of education to colleges that provide maximum service and empathetically treat their students. Thus, it can be assumed that the quality of service and image of institutions that are owned together will further affect student loyalty. The following is a contribution research from two aspects above (service quality and corporate image) to student loyalty with the research model that can be described as follows: