Impact of Nitrogen Fertilizer use on Soil Ecosystem Integrity in the Greater Port Harcourt Region, Nigeria
Wanjala, MP1
Odokuma, L2
Etela I3
Ramkat, R4
Odogwu, BA5
Boadu, KO6*
Koranteng-Addo E.J.7
2Department of Microbiology, University of Port Harcourt, Nigeria. |
AbstractFertilizers are used in agriculture to increase crop yields, but if they are misused, they can harm the integrity of soil ecosystems. The study's aim was to look at the impact of inorganic fertilizers on soil microbial populations in selected soils in the Greater Port Harcourt Area using Lethal Concentration 50 (LC50). The results revealed that the use of inorganic fertilizer altered soil microbial characteristics in three different settings: agricultural, urban, and industrial. For agricultural areas the maximum NPKB mean value was 0.70±0.76 ppm which was higher than the mean value of the control location of 0.23±0.00 ppm. In the agricultural area, UREA tolerant fungi had a lower LC50 mean value (0.43±0.09 ppm) than the control, which had a mean value of 0.46±0.00 ppm. The mean values in the industrial and urban areas were significantly different (p = 0.001). This study concluded that applying UREA and NPK fertilizers to study area soils lowered the pH of soils in agricultural sites (A1, A2, and A3). Fertilizer use in the study areas increased the population of microorganisms at threshold concentrations but was harmful at concentrations of 1.50 % or higher. Furthermore, findings revealed that microorganisms were more tolerant to fertilizers in agricultural areas (higher LC50 values) than in urban and industrial areas (lower LC50 values). According to the findings of this study, fertilizers used in the study areas were linked to soil microorganisms developing tolerance to NPK and UREA. Farmers should use the recommended amounts of fertilizer to ensure the soil ecosystem's integrity. |
Licensed: |
|
Keywords: |
|
Received: 2 June 2021 |
|
| (* Corresponding Author) |
Funding:The authors further acknowledge the Regional Universities Forum for Capacity Building in Agriculture (RUFORUM) through Dr. Odogwu A. Blessing and Professor Ikechukwu O. Agbagwa of University of Port Harcourt for their continual mentorship and financial support under the Carnegie Post-Doctoral funding. |
Competing Interests:The authors declare that they have no competing interests. |
Acknowledgement:This research has been carried out within the World Bank African Centre of Excellence for Oilfield Chemicals Research's PhD program, in line with the mandate of the World Bank to create the African Centre of Excellence at Port Harcourt University in Nigeria. |
1. Introduction
Fertilizers are used to increase crop yields in agriculture but may affect the integrity of soil ecosystems if misused (Cassou, Jaffee, & Ru, 2017). The potential of various soil types to lose nutrients and contaminants is a major factor impacting soil's ability to lose fertilizers (Crouse, 2017). In a situation of inorganic and organic phosphorus (P), this could be more closely linked to aluminium (Al), calcium (Ca) and iron (Fe) and cation exchange capacity for potassium and ammonium (Omuto & Vargas, 2018; Weil & Braddy, 2017). Consequently, this may minimize nutrient loss to water and air, thereby reducing nutrient availability for crops (Crouse, 2017). In addition, soil fertilizer value depends on several reasons; the ratio and nature of soil organic and mineral components (Bhogal et al., 2015) the duration of the seasonal environment that determines crop uptake, weather conditions and application history (Osborne & Wheeler, 2013). Such nutrient variation caused by the introduction and erosion of inorganic fertilizers can impact the composition and population of soil microorganisms. A study at Ebony State, Nigeria, has shown that inorganic fertilizers contribute to the spatial distribution of soil microorganisms (Alo, Egbule, Orji, & Aneke, 2013). Also, Xie et al. (2016) reported a decrease in the microbial population as soil contaminant levels. Cation levels in soil have also been attributed to influencing bacterial growth. A research by Hai-Hang, Zhang, and Pan (2010) showed that Al 2 +, Ca2 +, Cu2 +, Zn 2 +, Mn2 +, Mg2 + concentrations in the environment affect population and diversity of Rhodotorula glutinins and Pseudomonas spp. Organic matter levels, soil moisture, soil structure, and soil texture also affect hydrology and influence soil mineralization through influence on soil microorganism activity (Li et al., 2014). The content of clay in soil plays a significant role in protecting organic matter from microbial degradation (Lehtinen et al., 2014; McDonald, Watson, Lalor, Laughlin, & Wall, 2014). During crop production, application of fertilizers in soil affects soil microorganisms which are a cognitive indicator of soil health (Geisseler, Linquist, & Lazicki, 2017). Long-term experiments show that mineral fertilizers increase the population of microorganisms relative to unfertilized soils, as opposed to grassland habitats where the population of microorganisms is decreased by an increased N input (Liu & Greaver, 2010). With increased fertilisation using mineral fertilizers, the biomass of bacteria, actinomycetes and fungi increases. Fertilizers affect the bacteria to fungi ratio and even increase the Gram-positive to Gram-negative bacteria ratio (Geisseler et al., 2017). Studies of the impact of fertilizers on changes in populations and communities of microorganisms remain inconsistent, as some studies report growing soil microorganisms with increased levels of fertilizers, while others report decreasing soil microorganism populations with increased concentrations of fertilizers in growth media (Das & Adhya, 2014; Datta, Santra, & Adhya, 2013; Nakhro & Dkhar, 2010; Zhang et al., 2017), which are attributed to common site variables including soil and climatic properties (Geisseler et al., 2017). Fertilization affects the composition of the microorganisms in the community through changes in soil properties that depend on the initial soil characteristics. The impact of application of fertilizer strongly depends on environmental factors that are considerably variable among different sites (Geisseler et al., 2017). Therefore, research on the effect of fertilizer application on the population of microorganisms and diversity shifts in polluted environments is needed in order to have a clear understanding of the effects of fertilizers on the distribution of microorganisms in the soil. The scope of this research adds to the non-conclusive debate about the consequences of misuse of fertilizers in agricultural fields. Farmers must be aware of the impacts of fertilizer overuse or misuse on agricultural expanses. The results are essential for stakeholders and for decision taking to mitigate and restore deteriorated soils in the future.
2. Material and Methods
2.1. Description of Study Site
This research was carried out at 9 selected test sites and 3 control sites in Port Harcourt, Nigeria 's capital of Rivers State Figure 1. The sites of the study were divided into three areas: urban (GRA phase 2, Diobu- Mile 1 and Mguoba), industrial (Eleme hosting the NNPC refinery, Agbada-SPDC- flow station) and agricultural (Aluu, Oquwi- Eleme, Emuoha- Eu). The sites of the study were distinguished by different economic activities, as shown in Table 1.
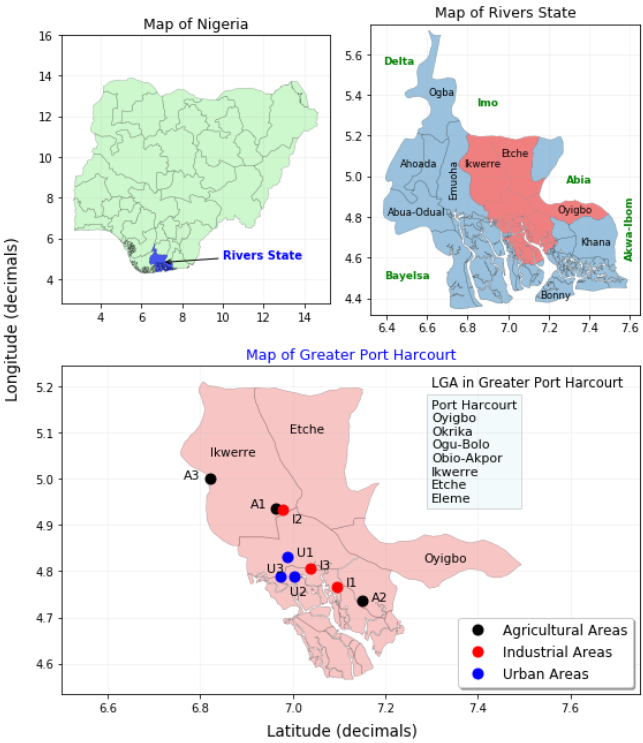
Figure-1. Location of sampling sites in selected areas in Greater Port Harcourt area, Rivers State, Nigeria.
Table-1. GPS coordinates and economic activities for sampling sites in selected areas in Greater Port Harcourt area, Rivers State, Nigeria. |
No |
Selected Study Sites |
Study Site Coding (Locations) | Coordinates N latitude E Longitude |
Characteristic and main activities |
|
1
2
3
4 |
Aluu Eleme Emuoha Control | Agricultural Area A1 A2 A3 CA |
4° 56’ 11.160’ 6° 57’ 52.248 4° 44’ 09.874’ 7° 08’ 58.494’ 5° 00’ 00.018’ 6° 49’ 13.032’ 5° 00’ 21.384’ 6° 49’ 00.000’ |
Flow station
Village close to refinery Flow station >1 km away from suspected areas |
|
1
2
3
4 |
Onne Agbada Trans-Amadi Control | Industrial Area I1 I2 I3 CI |
4° 46’ 00.402’ 7° 05’ 43.092’ 4° 56’ 03.444’ 6° 58’ 42.060’ 4° 48’ 20.455’ 7° 02’ 17.646’ 4° 47’ 13.788’ 7° 07’ 44.620’ |
Hosts the NNPC Refinery
Hosts SPDC- flow station in a rural setting Schlumberger/, Hallburton >1 km away from suspected areas |
|
1
2
3
4 |
GRA Phase 2 Diobu-Mile 1 Mgbuoba Control | Urban Area U1 U2 U3 CU |
4° 49’ 53.574’ 6° 59’ 45.552’ 4° 47’ 20.382’ 7° 00’ 13.164’ 4° 50’ 39.864’ 6° 58’ 20.232’ 4° 49’ 17,040’ 6° 59’ 24.168’ |
Inhabited areas Perecuma street Petroleum refinery NTA >1 km away from suspected areas |
2.2. Sampling
In the wet season (April to October 2018), composite samples were collected through random sampling from each of the three areas; urban, industrial, and agricultural. Five (5) separate samples were collected randomly around each test field. The five individual samples were thoroughly mixed by coning and quartering in a sterile container to attain a homogenous composite mixture. A total of 12 composite samples; A1, A2, A3, I1, I2, I3 U1, U2 and U3 as test samples, and CA, CI and CU as control samples Table 1 were collected from the top soil at depths of 0 to 15 cm using a standard auger 3 times during the rainy season. Homogenized composite samples (400 gm) were then packaged using a sterile wooden shovel into polyethylene bags. Samples were collected for microbial analysis using pre-sterilized materials to prevent contamination of the samples. Sampling locations were identified using a GPS and the recorded GPS readings. The samples were transported to the laboratory for analysis.
2.3. Laboratory Analysis
2.3.1. Enumeration of Fertilizer Tolerant Bacteria
The method pour plate method for enumeration of microbes was used to culture fertilizer-tolerant bacteria (APHA, 1998). Under aseptic conditions (in a laminar flow cabinet) one gram of soil sample was weighed into a 9 ml sterile diluent (0.85 % NaCl). The sample was then homogenized using a laboratory vortex mixer (Model 10101001, IP42) and serially diluted using sterile pipettes. Thereafter, 0.1 ml of inoculum aliquot was inoculated on mineral salt agar (MSA) that was then mixed with antifungal reagent (FunginTM) to inhibit fungal growth. Fixed dose procedure was used in which microorganisms were dosed in a step-by-step procedure using 0 %, 1 %, 5 %, 10 %, 15 %, 20 %, 25 %, 30 % and 60 % NPK and ammonia fertilizer concentrations. Based on sighting study, the very first dose levels were selected as the dose projected to show toxicity effects, without causing mortality. Depending on the presence or absence of toxicity or mortality signs, microorganisms were then dosed in the maximum or least set dosages. The dose continued until the dose was established / seen to cause apparent toxicity or no more than one death, or if there were no symptoms at the maximum or minimum dose or death. Plates were then incubated in an inverted position at room temperature (28 ° C) for 5 to 7 days. Colonies were counted so that units forming colony could be obtained per gram of soil.2.3.2. Enumeration of Fertilizer Tolerant Fungi
The pour plate method (APHA, 1998) was used to enumerate fertilizer-tolerant fungi. In this method, under aseptic conditions, 1 g of soil sample was weighed into a 9 ml sterile diluent (0.85 % NaCl). The sample was then homogenized using a vortex mixer (Model 10101001, IP42) and diluted in series using sterile pipettes. The Potato Dextrose Agar (PDA) was then inoculated in zero-point one (0.1 ml) aliquot of inoculum. A fixed dose procedure was used in which micro-organisms were dosed in a step-by-step procedure using fixed doses of [0 %, 0.10 %, 0.25 %, 0.75 %, 1 %, 1.25 %, 1.50 %, and 1.75 %] for NPK and UREA fertilizers. The initial dose levels were selected as the dose expected to produce toxicity effects, without causing mortality, based on sighting study. Microorganisms were then dosed at fixed doses higher or lower, depending on the presence or absence of toxicity or mortality signs. The dosage lasted until the dosage was confirmed to cause significant toxicity or no more than one death, or no signs were observed at the highest dose, or deaths occurred at the lowest dose. Plates were then incubated in an inverted position at room temperature (28 ° C) for 7 days. Colonies were counted using a colony counter to get units forming colony per gram of soil.
2.3.3. Determination of LC50 for Bacteria and Fungi
Percentages of dead organisms were determined at each concentration of the study and converted to probits (Finney's table). Regression analysis was conducted, where the probit analysis output was used to compare the amount of chemical required to create responses between micro-organisms from different areas of study to different concentrations of Ni / Cd in the culture medium (Vincent, 1980). Areas with lower LC50 values were found to be most toxic compared with areas with higher LC50 values (Vincent, 1980). Microorganisms were considered to be more tolerant to heavy metal exposure in areas with higher LC50 values. Lethal Concentration 50 (LC50) was determined by calculating the corresponding x value for a 5.00 probit and then taking the inverse log of the associated concentration (Vincent, 1980).
Y = ax + c………. (formula [1]).
where y = From Finney’s table.
a = Calculated coefficients.
x = Unknown value.
c = Calculated coefficients.
LC50 = Antilog of x
2.3.4. Data Analysis
Data analysis was conducted using the statistical software IBM SPSS Statistics for Windows, version 24.0. For multiple comparisons between the study areas and between seasons (wet and dry seasons), data obtained from laboratory analysis was analyzed using ANOVA. Analysis of the correlation was used to check the relationship between chemical variables in the soils and the microbe population. Each of the data collected in the study were analyzed at value levels р<0.05.
3. Results
3.1. Fertilizer Tolerant Microorganisms
3.1.1. UREA and NPK Tolerant Microorganisms
The values given in Table 2 and Table 2. show the mean values (LC50) of three independent tests. Lethal concentration 50 (LC50) levels for each study site were determined and compared with LC50 levels for control sites. Findings indicate variability in bacterial tolerance to various concentrations of fertilizers UREA and NPK. The mean value of LC50 for NPKF in agricultural area was 0.20±0.20 ppm which was lower than the control value of 0.47±0.15 ppm. Lethal concentration 50 (LC50) for NPKF was lower compared to the control samples in industrial and urban areas respectively Table 2 / Figure 2. The LC50 for NPKB control was 0.66±0.00 ppm higher than the 0.18±0.22 ppm test sample. In agricultural areas the highest NPKB mean value was 0.70±0.76 which was higher than the mean value of the control location (0.23±0.00 ppm) Table 2. The lowest lethal concentration (LC50) in industrial area for NPKB showed a mean of 0.34±0.15 ppm with the control sample being 0.24±0.00 ppm. The mean LC50 for UREAF in the agricultural area was 0.43±0.09 ppm, with a control mean of 0.46±0.00 ppm. Similarly, Industrial had a mean of 0.29±0.19 ppm with the control being 0.18±0.01 ppm, respectively. The urban areas also had mean of 0.23±0.06 ppm with the control having a mean of 0.17±0.01 ppm respectively. All of which were significantly different (p=0.001) Table 2. Test sites demonstrated greater tolerance for UREA compared with industrial and agricultural control samples. In the agricultural area, UREAB's lethal concentration 50 (LC50) had a mean of 0.26±0.21 ppm with a control having a mean of 0.64±0.02 ppm. Urea tolerant bacteria (UREAB's) control mean was higher than that of the test-value Table 3. The UREAB values for industrial and urban areas were 0.25±0.14 ppm and 0.04±0.01 ppm, and 0.49±0.63 ppm and 0.12±0.01 ppm, respectively Table 2. No significant variations in LC50 levels for UREA (p = 0.185) and NPK (p = 0.131) for bacteria were observed in all study sites Table 2.
Table-2. Variation of LC50 for fertilizer in fungi and bacteria in soil from agricultural, industrial and urban areas in Greater Port Harcourt area, Rivers State, Nigeria. |
| Study area | NPKF |
NPKB |
UREAF |
UREAB |
| Agriculture | 0.20±0.20a |
0.70±0.76a |
0.43±0.09bc |
0.26±0.21ab |
| Control Agriculture | 0.47±0.15b |
0.23±0.00a |
0.46±0.00c |
0.64±0.02b |
| Industry | 0.14±0.14a |
0.34±0.15a |
0.29±0.19ab |
0.25±0.14ab |
| Control Industry | 0.03±0.03a |
0.24±0.00a |
0.18±0.01a |
0.04±0.01a |
| Urban | 0.07±0.09a |
0.18±0.22a |
0.23±0.06a |
0.49±0.63ab |
| Control Urban | 0.06±0.04a |
0.66±0.00a |
0.17±0.01a |
0.12±0.01ab |
| P Value | 0.004 |
0.131 |
0.001 |
0.185 |
Note: Data are Mean ± standard deviations (Significant coefficients P=0.05). Different letters show that there is significant difference between the mean values. |
3.1.2. Comparison of NPK and UREA Tolerance among Microorganisms in Study and Control Areas
Figures 2 (a) and (b) compares the mean variation of LC50 for NPK tolerant fungi and bacteria to UREA. In the agricultural areas, NPK tolerant bacteria were higher compared with fungi (Figures 2 a). Control samples in industrial areas showed lower LC50 in both bacteria and fungi, respectively, compared to test areas. NPK recorded a higher LC50 value for bacteria as compared with fungi in urban areas (Figures 2 a). The agriculture areas showed the highest mean value of LC50 for NPK in fungi and bacteria. Figures 2 b shows higher UREA tolerance values for fungi and bacteria in agricultural areas compared with industrial and urban areas, with the exception of urban areas where urea-tolerant bacteria are higher than those in agricultural and industrial areas (Figures 2 b).
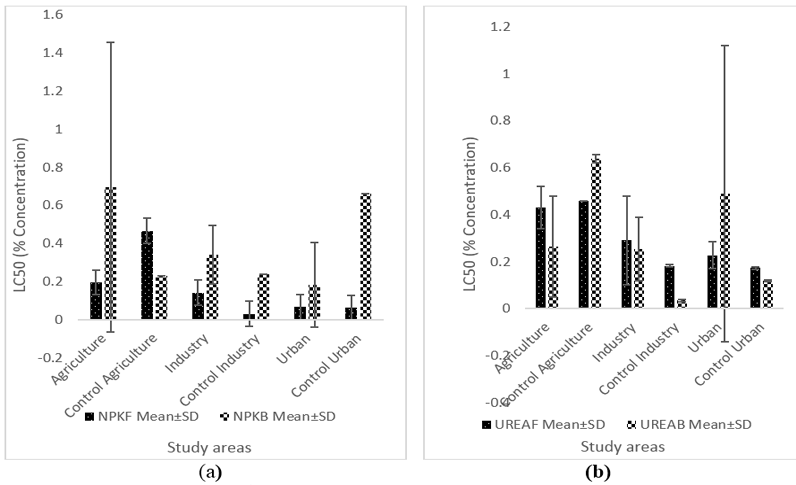
Figure-2. Variation in LC50 for NPK (a) and UREA (b) in fungi and bacteria in soil from agricultural, industrial and urban areas in Greater Port Harcourt Area, Rivers State, Nigeria. |
3.1.3. Mean concentrations of LC50 for NPK and UREA Tolerant Fungi and Bacteria in the Study Sites
Table 3 shows the mean variability for NPK and UREA resistant fungi and bacteria at different test and control sites. The highest NPKF values were 0.30±0.129, 0.47±0.151 and 0.44±0.151 ppm respectively at I2, CA and A3. The highest UREA tolerant fungi LC50 values were 0.54±0.01, 0.46±0.00, 0.54±0.05 and 0.40±0.00 ppm, respectively, recorded in I2, CA, A2 and A3. The highest mean values for NPK tolerant bacteria were recorded with mean concentrations of 0.51±0.00, 1.69±0.05, 0.66±0.00 and 0.48±0.00 respectively in I1, A1, CU and U2. Highest LC50 values were observed for UREA-tolerant bacteria in I3, CA, A1 and U2 which had values of 0.43±0.001, 0.64±0.02, 0.48±0.07 and 1.33±0.001 ppm. Agriculture sites showed the highest LC50 frequencies Table 3. The LC50 values were significantly different in the study sites (p ≤ 0.000). Mean pH values ranged from 5.22 through 7.96. Agricultural areas demonstrated the lowest pH of 5.22.
3.1.4. Bacteria Population in Different Concentrations of UREA and NPK Fertilizers
The values given in Table 4 presents the mean of three independent tests. The reductions in bacteria actively replicating and forming colonies as opposed to control indicated a decline in soil CFUs / g with an increase in UREA concentrations. There were variations in the study areas of maximum tolerable concentrations between bacteria ranging from 0.1 % to 1.75 % UREA concentrations. Sites I3, CA, A3, U2 and U3 showed growth at a maximum concentration of 1.75 %, ranging between 1.20 x 10³ and 5.47 x 10² CFUs / g of soil, whereas CI, I1, I2, A1, CU and U1 showed growth at a maximum concentration of 1.50 % of UREA, ranging between 1.03 x 10³ and 6.60 CFUs / g of soil (Table 4). The table also represents mean values of LC50 calculated from values from three independent tests.
Table-3. Variation of LC50 for fertilizer in fungi and bacteria in soil from agricultural, industrial and urban areas in Greater Port Harcourt Area, Rivers State, Nigeria. |
NPKF |
UREAF |
NPKB |
UREAB |
Soil pH -log_10[(ƩCi)/(n)] |
|
| CI | 0.031±0.034ab |
0.183±0.006b |
0.240±0.000c |
0.035±0.005ab |
7.96 |
| I1 | 0.088±0.063ab |
0.150±0.000a |
0.510±0.000b |
0.144±0.022de |
7.28 |
| I2 | 0.301±0.129cd |
0.543±0.012h |
0.157±0.029e |
0.188±0.053e |
6.49 |
| I3 | 0.039±0.036ab |
0.180±0.000b |
0.360±0.000d |
0.430±0.001g |
7.47 |
| CA | 0.466±0.151e |
0.460±0.000g |
0.230±0.000c |
0.640±0.017i |
7.47 |
| A1 | 0.127±0.081ab |
0.350±0.000e |
1.690±0.053g |
0.481±0.071h |
6.12 |
| A2 | 0.027±0.028ab |
0.543±0.046h |
0.034±0.028a |
0.310±0.001f |
5.22 |
| A3 | 0.436±0.151de |
0.400±0.000f |
0.367±0.012d |
0.001±0.000a |
5.89 |
| CU | 0.064±0.040ab |
0.173±0.006ab |
0.660±0.000f |
0.118±0.003cd |
7.32 |
| U1 | 0.176±0.090bc |
0.233±0.006c |
0.020±0.000a |
0.062±0.003b |
7.12 |
| U2 | 0.019±0.019ab |
0.290±0.000d |
0.480±0.000e |
1.330±0.001j |
7.52 |
| U3 | 0.008±0.010a |
0.160±0.000ab |
0.050±0.000a |
0.076±0.005bc |
7.10 |
| P Value | 0.000 |
0.000 |
0.000 |
0.000 |
|
Note: Data are Mean ± standard deviations (Significant coefficients P=0.05). Different letters show that there was significant difference between the mean values. |
The values given in Table 5 shows the mean of three independent tests. The decreases in bacterial actively replicating and forming colonies as compared to control showed a reduction in soil CFUs / g with an increase in NPK fertilizer concentrations. There were differences in the study areas of maximum tolerable concentrations among bacteria ranging from 0.25 % to 1.75 % NPK concentrations. Sites CI, I2, I3, CA, A2, A3, CU, U1, U2 and U3 showed growth at a maximum concentration of 1.50 %, ranging between 1.73 x 10³ and 4.57 x 10³ CFUs / g of soil, whereas I1 and A1 reported growth at a maximum concentration of 1.25 % of NPK fertilizers ranging between 1.23 x 10³ and 2.10 x 10³ CFUs / g of soil (Table 5). Furthermore, Table 5 represents mean LC50 values of % NPK fertilizers calculated from three independent test values.
3.1.5. Fungal Population in Increasing Concentrations of UREA and NPK Fertilizers
The values given in Table 6 show the mean of three independent tests. The declines in fungal actively replicating and forming colonies relative to control showed a decline in soil CFUs / g with an increase in UREA fertilizer concentrations. There were variations in the study areas between 0.25% and 1.75 % of UREA concentrations in the maximum tolerable concentrations among the fungi. Sites CI, I1, I2, I3, CA, A1, A2, CU, U1, U2 and U3 showed growth at a maximum concentration of 1.75 % with a count of 2.14 x 10³ CFUs / g of soil. Additionally, Table 6 shows mean LC50 values of % NPK fertilizers calculated from three independent test values.
The values given in Table 7 represent the mean of three independent tests. The decreases in fungal actively replicating and forming colonies as compared to the control showed a reduction in soil CFUs / g of soil with an increase in NPK fertilizer concentrations. There were differences in the study areas between 0.10 % and 1.75 % for UREA concentrations in the maximum tolerable concentrations among fungi. Sites CI, I1, I2, I3, CA, A1, A2, A3, CU, U1, U2 and U3 showed growth at a maximum concentration of 1.75 % with counts ranging between 3.33 x 101 to 1.03 x 10² CFUs / g soil. There was no variation in the maximum NPK fertilizer concentration which showed zero fungi growth. Furthermore, Table 7 reflects mean LC50 values of percent NPK fertilizers determined from three independent test values.
Table-4. Variation of bacterial populations in increasing concentrations of UREA fertilizer in soil from agricultural, industrial and urban areas in Greater Port Harcourt Area, Rivers State, Nigeria. |
| Sample | 0% |
0.25% |
0.5% |
0.75% |
1% |
1.25% |
1.50% |
1.75% |
2.0% |
LC50 |
| CI | 7.17 × 10⁷ |
5.73 × 10⁶ |
4.17 × 10⁵ |
3.27 × 10⁴ |
3.13 × 10³ |
2.43 × 10³ |
1.13 × 10³ |
0 |
0 |
0.04 |
| I1 | 1.37 × 10⁷ |
3.37 × 10⁶ |
2.03 × 10⁵ |
1.93 × 10⁴ |
1.77 × 10³ |
1.10 × 10³ |
1.03 × 10² |
0 |
0 |
0.14 |
| I2 | 7.43 × 10⁶ |
2.26 × 10⁶ |
3.12 × 10⁵ |
4.03 × 10⁴ |
3.67 × 10³ |
2.37 × 10³ |
1.27 × 10³ |
0 |
0 |
0.19 |
| I3 | 3.37 × 10⁷ |
5.40 × 10⁶ |
4.80 × 10⁵ |
6.97 × 10⁴ |
6.73 × 10³ |
2.53 × 10³ |
2.00 × 10³ |
1.30 × 10³ |
0 |
0.43 |
| CA | 6.17 × 10⁷ |
1.15 × 10⁷ |
9.53 × 10⁵ |
2.26 × 10⁴ |
1.77 × 10³ |
1.50 × 10³ |
6.87 × 10² |
0 |
0.64 |
|
| A1 | 1.30 × 10⁶ |
4.07 × 10⁵ |
1.72 × 10⁵ |
2.19 × 10⁴ |
1.78 × 10³ |
1.17 × 10³ |
6.60 × 10² |
0 |
0 |
0.48 |
| A2 | 7.07 × 10⁷ |
1.77 × 10⁷ |
3.63 × 10⁶ |
6.90 × 10⁴ |
6.67 × 10³ |
6.40 × 10³ |
5.90 × 10³ |
3.73 × 10³ |
0 |
0.31 |
| A3 | 5.73 × 10⁷ |
3.07 × 10⁶ |
2.73 × 10⁵ |
2.30 × 10⁴ |
1.65 × 10³ |
1.40 × 10³ |
1.10 × 10³ |
1.00 × 10³ |
0 |
0 |
| CU | 3.33 × 10⁶ |
1.34 × 10⁶ |
2.73 × 10⁵ |
2.42 × 10⁴ |
2.07 × 10³ |
1.60 × 10³ |
1.03 × 10³ |
0 |
0 |
0.12 |
| U1 | 4.57 × 10⁷ |
7.60 × 10⁶ |
5.67 × 10⁵ |
4.57 × 10⁴ |
3.33 × 10³ |
2.53 × 10³ |
1.53 × 10³ |
0 |
0 |
0.06 |
| U2 | 1.87 × 10⁷ |
5.07 × 10⁶ |
1.03 × 10⁶ |
3.70 × 10⁴ |
2.67 × 10³ |
1.90 × 10³ |
1.73 × 10³ |
1.47 × 10³ |
0 |
1.33 |
| U3 | 1.93 × 10⁷ |
3.20 × 10⁶ |
4.17 × 10⁵ |
7.03 × 10⁴ |
3.60 × 10³ |
3.30 × 10³ |
2.07 × 10³ |
0 |
0.08 |
Table-5. Variation of bacterial populations in increasing concentrations of NPK fertilizer in soil from agricultural, industrial and urban areas in Greater Port Harcourt Area, Rivers State, Nigeria. |
| Sample | 0% |
0.1% |
0.25% |
0.50% |
0.75% |
1.0% |
1.25% |
1.5% |
1.75% |
LC50 |
| CI | 7.17 × 10⁷ |
1.95 × 10⁷ |
1.21 × 10⁶ |
2.03 × 10⁴ |
2.48 × 10³ |
2.40 × 10³ |
2.27 × 10³ |
2.10 × 10³ |
0 |
0.24 |
| I1 | 1.37 × 10⁷ |
5.20 × 10⁶ |
3.37 × 10⁵ |
2.87 × 10⁴ |
2.37 × 10³ |
1.77 × 10³ |
1.67 × 10³ |
0 |
0 |
0.51 |
| I2 | 7.43 × 10⁶ |
2.42 × 10⁶ |
2.00 × 10⁵ |
3.60 × 10⁴ |
3.07 × 10³ |
2.77 × 10³ |
2.57 × 10³ |
2.43 × 10³ |
0 |
0.16 |
| I3 | 3.37 × 10⁷ |
8.47 × 10⁶ |
6.17 × 10⁵ |
5.17 × 10⁴ |
4.50 × 10³ |
4.23 × 10³ |
4.00 × 10³ |
3.50 × 10³ |
0 |
0.36 |
| CA | 6.17 × 10⁷ |
1.85 × 10⁷ |
1.07 × 10⁶ |
1.87 × 10⁴ |
3.07 × 10³ |
2.73 × 10³ |
2.47 × 10³ |
2.40 × 10³ |
0 |
0.23 |
| A1 | 1.30 × 10⁶ |
7.03 × 10⁵ |
3.57 × 10⁵ |
2.20 × 10⁴ |
2.03 × 10³ |
1.57 × 10³ |
1.23 × 10³ |
0 |
0 |
1.69 |
| A2 | 7.07 × 10⁷ |
5.77 × 10⁶ |
4.70 × 10⁵ |
3.00 × 10⁴ |
2.77 × 10³ |
2.37 × 10³ |
1.97 × 10³ |
1.73 × 10³ |
0 |
0.03 |
| A3 | 5.73 × 10⁷ |
1.03 × 10⁷ |
2.80 × 10⁵ |
2.20 × 10⁴ |
3.70 × 10³ |
3.50 × 10³ |
3.47 × 10³ |
3.27 × 10³ |
0 |
0.37 |
| CU | 3.33 × 10⁶ |
5.20 × 10⁵ |
1.31 × 10⁵ |
3.10 × 10⁴ |
2.77 × 10³ |
2.63 × 10³ |
2.47 × 10³ |
2.20 × 10³ |
0 |
0.66 |
| U1 | 4.57 × 10⁷ |
5.80 × 10⁶ |
5.03 × 10⁵ |
4.10 × 10⁴ |
3.60 × 10³ |
3.37 × 10³ |
3.17 × 10³ |
2.90 × 10³ |
0 |
0.02 |
| U2 | 1.87 × 10⁷ |
3.83 × 10⁶ |
2.60 × 10⁵ |
1.80 × 10⁴ |
5.47 × 10³ |
4.90 × 10³ |
4.70 × 10³ |
4.57 × 10³ |
0 |
0.48 |
| U3 | 1.93 × 10⁷ |
2.19 × 10⁶ |
3.03 × 10⁵ |
2.77 × 10⁴ |
2.77 × 10³ |
2.43 × 10³ |
2.03 × 10³ |
2.00 × 10³ |
0 |
0.05 |
Table-6. Variation in fungal populations in increasing concentrations of UREA fertilizer in soil from agricultural, industrial and urban areas in Greater Port Harcourt Area, Rivers State, Nigeria. |
| Sample | 0.0% |
0.25% |
0.50% |
0.75% |
1.0% |
1.25% |
1.50% |
1.75% |
LC 50 |
| CI | 5.20 × 10⁴ |
3.37 × 10⁴ |
2.27 × 10⁴ |
3.47 × 10³ |
2.38 × 10³ |
2.10 × 10³ |
1.54 × 10³ |
0 |
0.18 |
| I1 | 6.17 × 10⁵ |
4.50 × 10⁴ |
2.68 × 10⁴ |
3.43 × 10³ |
2.67 × 10³ |
1.81 × 10³ |
1.23 × 10³ |
0 |
0.15 |
| I2 | 1.32 × 10⁴ |
1.09 × 10⁴ |
6.23 × 10³ |
6.00 × 10³ |
5.77 × 10³ |
3.38 × 10³ |
2.44 × 10³ |
0 |
0.54 |
| I3 | 7.50 × 10⁴ |
3.57 × 10⁴ |
5.93 × 10³ |
1.71 × 10³ |
1.34 × 10³ |
1.20 × 10³ |
1.09 × 10³ |
0 |
0.18 |
| CA | 6.17 × 10³ |
4.60 × 10³ |
3.27 × 10³ |
1.82 × 10³ |
1.55 × 10³ |
1.28 × 10³ |
1.13 × 10³ |
0 |
0.46 |
| A1 | 1.45 × 10⁵ |
1.13 × 10⁵ |
6.33 × 10⁴ |
3.10 × 10⁴ |
2.01 × 10³ |
1.36 × 10³ |
1.18 × 10³ |
0 |
0.35 |
| A2 | 3.27 × 10⁴ |
3.20 × 10⁴ |
2.44 × 10⁴ |
1.19 × 10⁴ |
1.04 × 10⁴ |
1.85 × 10³ |
1.09 × 10³ |
0 |
0.54 |
| A3 | 8.23 × 10³ |
5.53 × 10³ |
4.57 × 10³ |
2.49 × 10³ |
2.14 × 10³ |
0 |
0 |
0 |
0.4 |
| CU | 7.70 × 10⁴ |
4.00 × 10⁴ |
6.83 × 10³ |
3.57 × 10³ |
2.74 × 10³ |
2.01 × 10³ |
1.21 × 10³ |
0 |
0.17 |
| U1 | 1.44 × 10⁴ |
5.67 × 10³ |
3.57 × 10³ |
2.61 × 10³ |
6.43 × 10² |
4.30 × 10² |
2.37 × 10² |
0 |
0.23 |
| U2 | 6.60 × 10⁴ |
4.60 × 10⁴ |
2.21 × 10⁴ |
7.23 × 10³ |
5.53 × 10³ |
5.23 × 10³ |
1.31 × 10³ |
0 |
0.29 |
| U3 | 6.23 × 10⁴ |
3.60 × 10⁴ |
5.03 × 10³ |
2.90 × 10³ |
1.57 × 10³ |
1.16 × 10³ |
2.97 × 10² |
0 |
0.16 |
Table-7. Variation in fungal populations in increasing concentrations of NPK fertilizer in soil from agricultural, industrial and urban areas in Greater Port Harcourt Area, Rivers State, Nigeria. |
| Sample | 0.10% |
0.25% |
0.50% |
0.75% |
1% |
1.25% |
1.50% |
1.75% |
LC50 | |
| CI | 5.20 × 10⁴ |
2.18 × 10⁴ |
7.17 × 10³ |
6.90 × 10³ |
6.47 × 10³ |
5.87 × 10³ |
4.27 × 10³ |
1.41 × 10³ |
8.33 × 101 |
0.03 |
| I1 | 6.17 × 10⁵ |
9.90 × 10⁴ |
2.54 × 10⁴ |
6.83 × 10³ |
6.23 × 10³ |
6.00 × 10³ |
5.17 × 10³ |
1.48 × 10³ |
6.67 × 101 |
0.09 |
| I2 | 1.32 × 10⁴ |
9.20 × 10³ |
6.80 × 10³ |
6.37 × 10³ |
5.73 × 10³ |
4.90 × 10³ |
3.69 × 10³ |
8.34 × 10² |
4.00 × 101 |
0.3 |
| I3 | 7.50 × 10⁴ |
5.87 × 10⁴ |
8.37 × 10³ |
5.01 × 10³ |
3.87 × 10³ |
2.99 × 10³ |
2.15 × 10³ |
8.08 × 10² |
7.67 × 101 |
0.04 |
| CA | 6.17 × 10³ |
5.40 × 10³ |
4.73 × 10³ |
3.58 × 10³ |
2.78 × 10³ |
1.71 × 10³ |
1.19 × 10³ |
4.11 × 10² |
3.67 × 101 |
0.47 |
| A1 | 1.43 × 10⁵ |
9.23 × 10⁴ |
3.08 × 10⁴ |
4.88 × 10³ |
2.91 × 10³ |
2.28 × 10³ |
1.63 × 10³ |
4.93 × 10² |
4.67 × 101 |
0.13 |
| A2 | 3.27 × 10⁴ |
1.51 × 10⁴ |
5.07 × 10³ |
4.53 × 10³ |
4.05 × 10³ |
3.63 × 10³ |
2.75 × 10³ |
9.42 × 10² |
9.33 × 101 |
0.03 |
| A3 | 8.23 × 10³ |
6.67 × 10³ |
5.48 × 10³ |
4.86 × 10³ |
3.14 × 10³ |
2.28 × 10³ |
1.49 × 10³ |
4.04 × 10² |
3.33 × 101 |
0.44 |
| CU | 7.70 × 10⁴ |
5.56 × 10⁴ |
1.17 × 10⁴ |
6.07 × 10³ |
4.57 × 10³ |
4.17 × 10³ |
2.93 × 10³ |
7.49 × 10² |
3.67 × 101 |
0.06 |
| U1 | 1.44 × 10⁴ |
8.77 × 10³ |
5.50 × 10³ |
4.12 × 10³ |
2.95 × 10³ |
1.95 × 10³ |
1.34 × 10³ |
5.39 × 10² |
7.00 × 101 |
0.18 |
| U2 | 6.60 × 10⁴ |
2.62 × 10⁴ |
5.10 × 10³ |
4.58 × 10³ |
3.57 × 10³ |
2.62 × 10³ |
2.15 × 10³ |
7.45 × 10² |
3.33 × 101 |
0.02 |
| U3 | 6.23 × 10⁴ |
2.55 × 10⁴ |
5.40 × 10³ |
4.70 × 10³ |
4.20 × 10³ |
3.63 × 10³ |
2.68 × 10³ |
1.05 × 10³ |
0.01 |
4. Discussion
Inorganic fertilizers are important in the green revolution and growing farm yields, but misuse of fertilizers can result in a loss of the soil ecosystem integrity. Achieving food security is a key agenda that eludes Governments in sub-Saharan Africa (SSA) (Shapouri, Rosen, Peters, Baquedano, & Allen, 2010). Low food crop productivity due to reduced organic fertilizers is one of the main contributors to SSA food scarcity in a region that has also experienced land degradation from oil spills for several decades (Muller et al., 2012) as well as post-harvest losses and unequal distribution of food. There is a rise in fertilizer use in countries that provide input subsidies, such as Kenya, Nigeria, Tanzania and Malawi (Druilhe & Barreiro-Hurlé, 2012), which is expected to increase further in the years ahead. During several years past, application rates for fertilizers were based on blanket guidelines (Giller et al., 2011). Data that can help determine the correct levels of fertilizer and application for the specific plants and sites is crucial for improving efficiency of fertilizer use and minimizing negative environmental impacts.
Soil micro-organisms play a pivotal role in the ecosystem, including the bioremediation of contaminated sites, nutrient cycling and the promotion of plant growth. Therefore, in terms of diversity and population, optimum levels of micro-organisms in soil need to be maintained for sustainable agriculture (Bhat, 2013; Delgado-Baquerizo et al., 2016). Changes in soil parameters are followed by differences in microorganism group composition and function (Kennedy & Smith, 1995). Hence it is necessary to understand the population and diversity of microbial soil communities in order to enforce soil restoration. In this research, fungal and bacterial populations have been used to demonstrate the effect of consistent use of NPK and UREA fertilizers on tolerance of microorganisms with a view to ensuring sustainable use of fertilizers and conservation of the environment. The lethal concentration 50 (LC50) was used to evaluate the effect of the fungi and bacteria exposure to fertilizer (NPK and UREA). Findings suggest that bacteria had a greater tolerance to NPK than fungi in agricultural areas. Test samples in urban areas showed lower LC50 in both bacteria and fungi, suggesting anthropogenic activity in the study sites may have had an effect on the soil. For NPK fertilizer, a higher value of LC50 was observed in the urban area for bacteria as compared with fungi. In agricultural areas the highest mean LC50 for NPK was observed in fungi, and the highest mean LC50 for NPK-tolerant bacteria was also found in agricultural areas. The findings of this study also indicate higher UREA tolerance values for fungi and bacteria in agricultural areas relative to industrial and urban areas, except for some urban areas where UREA tolerant bacteria were higher than those in agricultural and industrial areas. The fungal and bacterial populations differentiated between research sites and were linked to fertilizer treatments in their natural habitats with pre-exposure. These findings are consistent with findings from (Xue et al., 2016) that define soil microorganisms that will be affected by long-term field application of fertilizers. Tolerance found in urban bacteria can also be related to exposure to pollutants from domestic and industrial areas.
N fertilizer application significantly reduces soil pH, regardless of soil type (Dong et al., 2012; Zhang et al., 2017). This is well documented and is primarily the result of soil processes that produce protons, including oxidation of ammonium to nitrite, nitrate and nitrification (Dong et al., 2012). A study across China showed that soil pH decreases of 0.45–2.20 units resulting from 8 to 25 years of N fertilization (Yu et al., 2016). Agricultural soils are subjects of the greatest N-induced pH decreases, suggesting that these soils were more exposed to N fertilizers than urban and industrial soils. This is consistent with other studies that show a strong link between acidification and application rate for N (Yu et al., 2016). The explanation for this may be linked to the fact that the neutralizing effect of plant nitrate absorption had decreased when excess N was added (Yu et al., 2016). Nitrogen fertilization in urban, industrial, and agricultural soils substantially decreased microbial populations. The LC50 values, however, showed that this exposure to N fertilizers favoured the development of N tolerance among microbes. Thereafter, the distribution was affected by the activities in the above mentioned areas. This is consistent with several other studies that find repeated application of N fertilizers affecting the microbial soil population relative to control sites (Geisseler & Scow, 2014; Wang, Liu, & Bai, 2018; Zhang et al., 2017; Zhang et al., 2016). Soil microorganisms may use UREA as a source of nitrogen, and may also be inhibited by the addition of high urea levels due to ammonia toxicity (Veverka, Štolcová, & Růžek, 2007). Nonetheless, the reduction in N-fertilization in the fungal and bacterial population was not synchronous, resulting in a significant reduction in the fungus-to-bacteria ratio in N-fertilized soils relative to non-fertilized soils. Fungi were more susceptible to changes in pH relative to bacteria (Bünemann, Schwenke, & Van Zwieten, 2006; Veverka et al., 2007). As a result, fungal populations fell faster than bacterial populations with pH decreases induced by N fertilization, particularly given that the pH ranges in our study sites were much more beneficial to bacteria than fungi (Veverka et al., 2007).
Cederlund et al. (2014) showed that fertilization with N is the most effective factor for increasing the relative abundance of soil bacteria. Several authors have noted changes in the abundance of certain bacterial classes, such as Bacteroidetes, some members of Proteobacteria, Acidbacteria, Gemmatimonadetes and Verrucomicrobia, when comparing N fertilized soils with controls (Fierer et al., 2012; Nemergut et al., 2008; Ramirez, Lauber, Knight, Bradford, & Fierer, 2010). Microorganisms were not described in our study, but fertilizer tolerance levels were measurements of vulnerability of the soil ecosystems. Remarkably observed high LC50 values in agricultural areas indicate that they react to the fertilizers used, as their apparent population growth in the presence of NPK and UREA fertilizers has been favoured. The existence of N in complex macromolecules, such as organic fertilizers, may have enriched various classes of species with prompt metabolizing adaptation in the presence of nutrients, as a potential reason for this result. Conversely, the presence of UREA, which is a simple source of N for micro-organisms, should have played a more neutral role rather than supporting a single micro-organism. For example, bacteroidetes are considered copiotrophic (r-selected), and their rise in abundance has already been documented in the presence of easily accessible N fertilization (Nemergut et al., 2008; Ramirez et al., 2010). On the other hand, armatimonadetes and nitrospirae appear to be negatively affected by N fertilizers, which were expected to be as readily available as N induces an out competition mainly of autotrophic nitrospirae microbes (Ramirez et al., 2010). These are indications that different fertilizers affect different microorganisms in unique manner which is similar to findings of the current study.
The results found by Fierer et al. (2012) are consistent with our findings that after exposure to N fertilizers the tolerance of soil microorganisms to fertilizer toxicity could be related to microbial diversity and tolerance adaptations. Exposure to fertilizers may trigger changes in community makeup of soil microorganisms. By comparison other scientists (Zanardo et al., 2018) observed a decline in bacterial diversity with N additions. These two opposing versions indicate that the effects of N modifications on microbial populations are variable and dependent on the site as well as microbial tolerance production, or even other effects such as soil pH shifts, soil holding ability and water micronutrient status. For tuber and root crop growth, NPK fertilizers are more often used (Geisseler et al., 2017), while UREA is widely used by farmers as a synthetic fertilizer as it has a fairly high N content (45 per cent). Pieri (1992) observed that N fertilizers in the West African region have close links with acidification, with an average annual rise of 10 % in Al saturation, it was proposed that after only a few years of cultivation they achieved a critical Al toxicity level of 30 %. Ogbodo (2013), listed the most significant negative impacts associated with soil acidification as aluminium toxicity (Al) and manganese toxicity (Mg). Typical in these soils, complex aluminium, Al (OH), is converted to ionic form (Al3+) at low pH values.
As observed in soils with very high organic matter (Ogbodo, 2013; Zanardo et al., 2018), the soil microbial population is very high. The LC50 findings in the current research have led us to believe that the microbes can vary depending on the presence of organic material in the soils and are indigenous to the sampling sites. The suggestion could be that the microbes could maintain their populations in polluted environments, even under inorganic fertilizers and acidic conditions. The microbes were the primary beneficiaries of the applied fertilizer nutrients, readily available which they assimilated and achieved growth and multiplication at optimum concentrations but were impaired in concentrations beyond the threshold limits.
5. Conclusion and Recommendation
This research concludes that the application of UREA and NPK fertilizers in study area soils decreased the pH of soils in A1(Aluu), A2 (Eleme) and A3 (Emohua) agricultural areas. Application of UREA and NPK fertilizers in soils of the study areas increased the population of microorganisms in threshold concentrations but is detrimental for NPK and UREA fertilizers at concentrations of 1.50 % or above. Results showed that micro-organisms were more tolerant of NPK and UREA in agricultural areas compared with urban and industrial areas, which showed higher LC50 values. This study concludes that fertilizers used in the study areas were linked to the development of NPK and UREA tolerance among soil microorganisms and were characterized in the study areas by the community of NPK and UREA tolerant microorganisms. The study recommends isolation and characterization in agricultural areas of fungi and bacteria to create a consortium of fertilizer-tolerant microorganisms for the remediation of fertilizer-degraded land. It is crucial that the farmers should observe the application of recommended fertilizer quantities to ensure the soil ecosystem integrity is sustained.
References
Alo, M. N., Egbule, U. C. C., Orji, J. O., & Aneke, C. J. (2013). Microbiological analysis of soil from onu-ebonyi contaminated with inorganic fertilizer. American Journal of Infectious Diseases and Microbiology, 1(4), 70-74. Available at: https://doi.org/10.12691/ajidm-1-4-3.
APHA. (1998). Standard methods for the examination of water and wastewater (20th ed., Vol. 9, pp. 56-66). Washington DC: American Public Health Association, American Water Works Association and Water Environmental Federation.
Bhat, A. (2013). Preserving microbial diversity of soil ecosystem: A key to sustainable productivity. International Journal of Current Microbiology and Applied Sciences, 2(8), 85-101. Available at: https://doi.org/10.1079/9781845938093.0158.
Bhogal, A., Williams, J., Nicholson, F., Chadwick, D., Chambers, K., & Chambers, B. J. (2015). Mineralisation of organic nitrogen from farm manure applications. Soil Use Manage, 32(1), 32–43. Available at: https://doi.org/10.1111/sum.12263.
Bünemann, E. K., Schwenke, G., & Van Zwieten, L. (2006). Impact of agricultural inputs on soil organisms—a review. Soil Research, 44(4), 379-406. Available at: https://doi.org/10.1071/sr05125.
Cassou, E., Jaffee, S. M., & Ru, J. (2017). The challenge of agricultural pollution: Evidence from China, Vietnam, and the Philippines. Reconstruction and Development / The World Bank Group. Available at: https://doi.org/10.1596/978-1-4648-1201-9.
Cederlund, H., Wessén, E., Enwall, K., Jones, C. M., Juhanson, J., Pell, M., . . . Hallin, S. (2014). Soil carbon quality and nitrogen fertilization structure bacterial communities with predictable responses of major bacterial phyla. Applied Soil Ecology, 84, 62-68. Available at: https://doi.org/10.1016/j.apsoil.2014.06.003.
Crouse, D. A. (2017). Soils and plant nutrients, North Carolina extension gardener handbook. NC State Extension, Raleigh, NC. Retrieved from: https://content.ces.ncsu.edu/extension-gardener-handbook/1-soils-and-plant-nutrients.
Das, S., & Adhya, T. K. (2014). Effect of combine application of organic manure and inorganic fertilizer on methane and nitrous oxide emissions from a tropical flooded soil planted to rice. Geoderma, 213, 185-192. Available at: https://doi.org/10.1016/j.geoderma.2013.08.011.
Datta, A., Santra, S., & Adhya, T. (2013). Effect of inorganic fertilizers (N, P, K) on methane emission from tropical rice field of India. Atmospheric Environment, 66, 123-130. Available at: https://doi.org/10.1016/j.atmosenv.2012.09.001.
Delgado-Baquerizo, M., Maestre, F. T., Reich, P. B., Jeffries, T. C., Gaitan, J. J., Encinar, D., & Singh, B. K. (2016). Microbial diversity drives multifunctionality in terrestrial ecosystems. Nature Communications, 7(1), 10541. Available at: https://doi.org/10.1038/ncomms10541.
Dong, W., Zhang, X., Wang, H., Dai, X., Sun, X., Qiu, W., & Yang, F. (2012). Effect of different fertilizer application on the soil fertility of paddy soils in red soil region of Southern China. PLoS ONE, 7(9), 1–9. Available at: https://doi.org/10.1371/journal.pone.0044504.
Druilhe, Z., & Barreiro-Hurlé, J. (2012). Fertilizer subsidies in Sub-Saharan Africa. ESA Working Paper No. 12-04 FAO, Rome. Retrieved from: http://www.fao.org/3/ap077e/ap077e.pdf .
Fierer, N., Leff, J. W., Adams, B. J., Nielsen, U. N., Bates, S. T., Lauber, C. L., . . . Caporaso, J. G. (2012). Cross-biome metagenomic analyses of soil microbial communities and their functional attributes. Proceedings of the National Academy of Sciences, 109(52), 21390-21395. Available at: https://doi.org/10.1073/pnas.1215210110.
Geisseler, D., Linquist, B. A., & Lazicki, P. A. (2017). Effect of fertilization on soil microorganisms in paddy rice systems–A meta-analysis. Soil Biology and Biochemistry, 115, 452-460. Available at: https://doi.org/10.1016/j.soilbio.2017.09.018.
Geisseler, D., & Scow, K. M. (2014). Long-term effects of mineral fertilizers on soil microorganisms–A review. Soil Biology and Biochemistry, 75, 54-63. Available at: https://doi.org/10.1016/j.soilbio.2014.03.023.
Giller, K. E., Tittonell, P., Rufino, M. C., van Wijk, M. T., Zingore, S., Mapfumo, P., . . . Vanlauwe, B. (2011). Communicating complexity: integrated assessment of trade-offs concerning soil fertility management within African farming systems to support innovation and development. Agricultural Systems, 104(2), 191-203. Available at: https://doi.org/10.1016/j.agsy.2010.07.002.
Hai-Hang, L., Zhang, Z. Y., & Pan, L. P. (2010). Isolation, identification and characterization of soil microbes which degrade phenolic allelochemicals Journal compilation ª 2009. The society for applied microbiology. Journal of Applied Microbiology, 108, 1839-1849. Available at: https://doi.org/10.1111/j.1365-2672.2009.04589.x.
Kennedy, A. C., & Smith, K. (1995). Soil microbial diversity and the sustainability of agricultural soils. Plant and Soil, 170(1), 75-86. Available at: https://doi.org/10.1007/978-94-011-0479-1_6.
Lehtinen, T., Schlatter, N., Baumgarten, A., Bechini, L., Krüger, J., Grignani, C., . . . Spiegel, H. (2014). Effect of crop residue incorporation on soil organic carbon and greenhouse gas emissions in European agricultural soils. Soil Use and Management, 30(4), 524-538. Available at: https://doi.org/10.1111/sum.12151.
Li, Y., Liu, Y., Wang, Y., Niu, L., Xu, X., & Tian, Y. (2014). Interactive effects of soil temperature and moisture on soil N mineralization in a Stipa krylovii grassland in Inner Mongolia, China. Journal of Arid Land, 6(5), 571-580. Available at: https://doi.org/10.1007/s40333-014-0025-5.
Liu, L., & Greaver, T. L. (2010). A global perspective on belowground carbon dynamics under nitrogen enrichment. Ecology Letters, 13(7), 819 to 828. Available at: https://doi.org/10.1111/j.1461-0248.2010.01482.x.
McDonald, N. T., Watson, C. J., Lalor, S. T., Laughlin, R. J., & Wall, D. P. (2014). Evaluation of soil tests for predicting nitrogen mineralization in temperate grassland soils. Soil Science Society of America Journal, 78(3), 1051-1064. Available at: https://doi.org/10.2136/sssaj2013.09.0411.
Muller, N. D., Gerber, J. S., Johnston, M., Ray, D. K., Ramankutty, N., & Foley, J. A. (2012). Closing yield gaps through nutrient and water management. Nature, 490(7419), 254-257. Available at: https://doi.org/10.1038/nature11420.
Nakhro, N., & Dkhar, M. (2010). Populations and biomass carbon in paddy field soil. Agron J, 9(3), 102-110. Available at: https://doi.org/10.3923/ja.2010.102.110.
Nemergut, D. R., Townsend, A. R., Sattin, S. R., Freeman, K. R., Fierer, N., Neff, J. C., . . . Schmidt, S. K. (2008). The effects of chronic nitrogen fertilization on alpine tundra soil microbial communities: Implications for carbon and nitrogen cycling. Environmental Microbiology, 10(11), 3093-3105. Available at: https://doi.org/10.1111/j.1462-2920.2008.01735.x.
Ogbodo, E. N. (2013). Impact of the use of Inorganic fertilizers to the soils of the ebonyi state agro-ecology. South-Eastern Nigeria, 3(7), 33–39.
Omuto, C., & Vargas, R. (2018). Soil nutrient loss assessment in Malawi (pp. 1–64). Technical Report. FAO, UNEP and UNDP.
Osborne, T. M., & Wheeler, T. R. (2013). Evidence for a climate signal in trends of global crop yield variability over the past 50 years. Environmental Research Letters, 8(2), 024001. Available at: https://doi.org/10.1088/1748-9326/8/2/024001.
Pieri, C. J. M. G. (1992). Fertility of soils: A future for farming in the West African savannah. Berlin: Springer-Verlag.
Ramirez, K. S., Lauber, C. L., Knight, R., Bradford, M. A., & Fierer, N. (2010). Consistent effects of nitrogen fertilization on soil bacterial communities in contrasting systems. Ecology, 91(12), 3463-3470. Available at: https://doi.org/10.1890/10-0426.1.
Shapouri, S., Rosen, S., Peters, M., Baquedano, F., & Allen, S. (2010). Allen food security assessment, 2010–20: A report from the economic research service. United States Department of Agriculture (USDA).
Veverka, K., Štolcová, J., & Růžek, P. (2007). Sensitivity of fungi to urea. Plant Protect. Science, 43(3), 157–164.
Vincent, B. K. (1980). Probit analysis. 1 -8. Retrieved from: http://www.med.mcgill.ca/epidemiology/hanley/anniversaries/ByTopic/ProbitAnalysisVincentSFU.pdf .
Wang, C., Liu, D., & Bai, E. (2018). Decreasing soil microbial diversity is associated with decreasing microbial biomass under nitrogen addition. Soil Biology and Biochemistry, 120, 126-133. Available at: https://doi.org/10.1016/j.soilbio.2018.02.003.
Weil, R. R., & Braddy, N. C. (2017). Soil phosphorus and potassium (15th ed., Vol. 14, pp. 643–695): The Nature and Properties of Soils.
Xie, Y., Fan, J., Zhu, W., Amombo, E., Lou, Y., Chen, L., & Fu, J. (2016). Effect of heavy metals pollution on soil microbial diversity and bermudagrass genetic variation. Frontiers in Plant Science, 7, 755. Available at: https://doi.org/10.3389/fpls.2016.00755.
Xue, C., Zhang, X., Zhu, C., Zhao, J., Zhu, P., Peng, C., & Shen. (2016). Quantitative and compositional responses of ammonia-oxidizing archaea and bacteria to long-term field fertilization. Scientific Reports, 6, 1–11. Available at: https://doi.org/10.1038/srep28981.
Yu, H., Gao, Q., Shao, Z., Ying, A., Sun, Y., Liu, J., & Zhang, B. (2016). Decreasing nitrogen fertilizer input had little effect on microbial communities in three types of soils. PLoS ONE, 11(3), 1–12. Available at: https://doi.org/10.1371/journal.pone.0151622.
Zanardo, M., Rosselli, R., Meneghesso, A., Sablok, G., Stevanato, P., Engel, M., & Squartini, A. (2018). Response of bacterial communities upon application of different innovative organic fertilizers in a greenhouse experiment using low-nutrient soil cultivated with cynodon dactylon. 1–11. Available at: https://doi.org/10.3390/soilsystems2030052.
Zhang, Y., Shen, H., He, X., Thomas, B. W., Lupwayi, N. Z., Hao, X., . . . Shi, X. (2017). Fertilization shapes bacterial community structure by alteration of soil pH. Frontiers in Microbiology, 8, 1325. Available at: https://doi.org/10.3389/fmicb.2017.01325.
Zhang, Z., Zhang, X., Mahamood, M., Zhang, S., Huang, S., & Liang, W. (2016). Effect of long-term combined application of organic and inorganic fertilizers on soil nematode communities within aggregates. Scientific Reports, 6(1), 1-12. Available at: https://doi.org/10.1038/srep31118.